Tool Windows
This section describes various interactive Tool Windows that are provided with Message Analyzer to display additional message details such as field information, message stack, hexadecimal, diagnosis, and decryption data. Some Tool Windows support data analysis capabilities such as the application of Viewpoints, view Filters, and selection of messages. Others enable you to configure annotations such as comments and bookmarks, or to add new data columns to the Analysis Grid viewer based on selected message fields.
Certain Tool Windows provide a multi-instance capability that enables you to display up to a maximum of four windows of the same type. This feature enhances your data analysis process because it enables you to compare different message data across multiple instances of the same window type. The Tool Windows that support this capability include the Details, Message Data, and Message Stack windows.
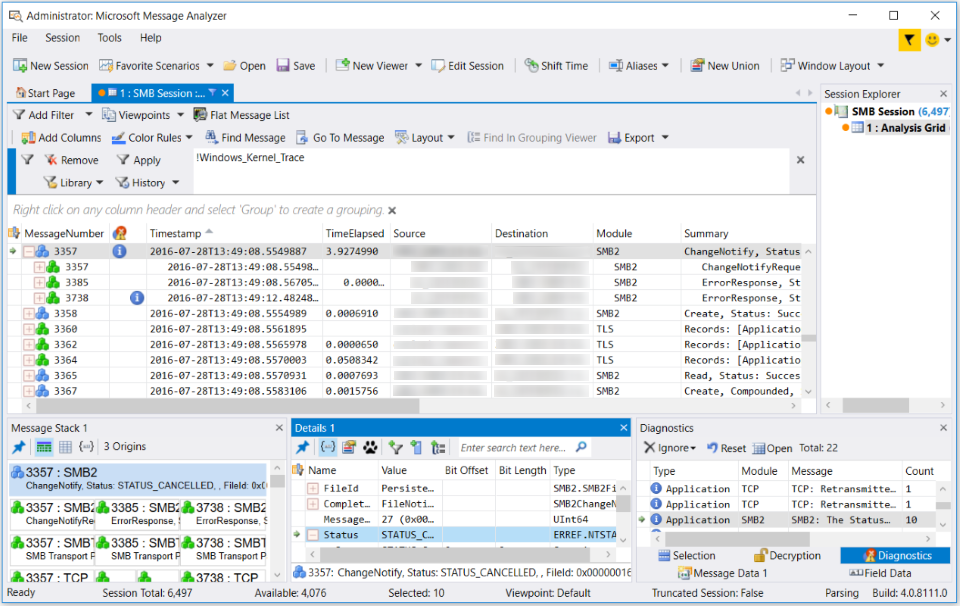
The Analysis Grid viewer and some common Tool Windows are shown in the figure that follows. Note that a number of Tool Windows are grouped in the lower right sector of the Message Analyzer user interface, where you can display any chosen Tool Window by selecting its tab.

Figure 65: Analysis Grid viewer and Common Tool Windows
The ability to maintain the context of displayed data through multiple message selection is described in further detail in the associated Tool Window topics of this section.
Some Tool Windows are message-specific while others are session-specific, meaning that they respond to message or session selection, respectively, and display data that is associated with the in-focus message or session. An example of a message-specific Tool Window is the Message Stack window and an example of a session-specific Tool Window is the Diagnostics window, which are both described within the topics of this section along with other Tool Window types:
Message-Specific Windows
Session-Specific Windows
Annotation Windows
Other Windows