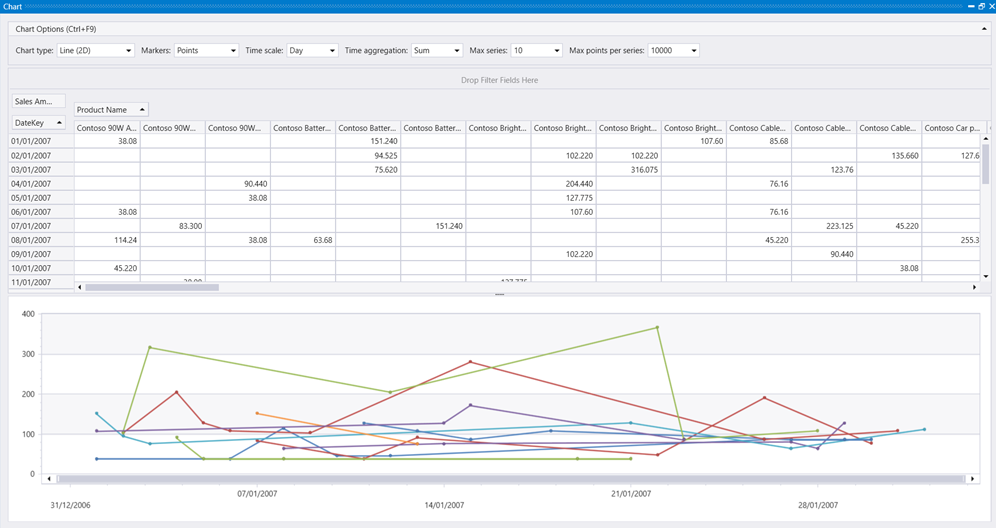
樞紐分析圖
適用於:✅Microsoft網狀架構✅Azure 數據✅總管 Azure 監視器✅Microsoft Sentinel
顯示數據透視表和圖表。 您可以以互動方式選取資料、數據行、數據列和各種圖表類型。
注意
- 此視覺效果只能在轉譯運算符的內容中使用。
- 此視覺效果可用於 Kusto.Explorer,但無法在 Azure 數據總管 Web UI 中使用。
語法
T | render pivotchart
深入瞭解 語法慣例。
參數
| 姓名 | 類型 | 必要 | 描述 |
|---|---|---|---|
| T | string |
✔️ | 輸入數據表名稱。 |
範例
SalesFact
| join kind= inner Products on ProductKey
| where ProductCategoryName has "Computers" and ProductName has "Contoso"
| where DateKey between (datetime(2006-12-31) .. datetime(2007-02-01))
| project SalesAmount, ProductName, DateKey
| render pivotchart
