直條圖
適用於:✅Microsoft網狀架構✅Azure 數據✅總管 Azure 監視器✅Microsoft Sentinel
柱形圖視覺效果在查詢結果中至少需要兩個數據行。 根據預設,第一個數據行會當做 x 軸使用。 此數據列可以包含文字、日期時間或數值數據類型。 其他數據行會當做 Y 軸使用,並包含要顯示為垂直線的數值數據類型。 柱形圖可用來比較主要類別範圍中的特定子類別專案,其中每一條線的長度代表其值。
注意
此視覺效果只能在轉譯運算符的內容中使用。
語法
T columnchart render | [with( propertyName = propertyValue [, ...]])
深入瞭解 語法慣例。
參數
| 姓名 | 類型 | 必要 | 描述 |
|---|---|---|---|
| T | string |
✔️ | 輸入數據表名稱。 |
| propertyName、 propertyValue | string |
索引鍵/值屬性組的逗號分隔清單。 請參閱 支持的屬性。 |
支援的屬性
所有屬性都是選擇性的。
| PropertyName | PropertyValue |
|---|---|
accumulate |
每個量值的值是否會新增至其所有前置專案。 (true 或 false) |
kind |
進一步闡述視覺效果種類。 如需詳細資訊,請參閱 kind 屬性。 |
legend |
是否要顯示圖例(visible 或 hidden)。 |
series |
以逗號分隔的數據行清單,其合併每個記錄值會定義記錄所屬的數位。 |
ymin |
要顯示在 Y 軸上的最小值。 |
ymax |
要顯示在 Y 軸上的最大值。 |
title |
視覺效果的標題(類型 string為 )。 |
xaxis |
如何縮放 X 軸 (linear 或 log)。 |
xcolumn |
結果中的哪一個數據行用於 x 軸。 |
xtitle |
x 軸的標題(類型為 string)。 |
yaxis |
如何縮放 Y 軸 (linear 或 log)。 |
ycolumns |
以逗號分隔的數據列清單,其中包含 x 資料行每個值所提供的值。 |
ytitle |
y 軸的標題(類型 string為 )。 |
ysplit |
如何將視覺效果分割成多個 Y 軸值。 如需詳細資訊,請參閱 ysplit 屬性。 |
ysplit 屬性
此視覺效果支援分割成多個 Y 軸值:
ysplit |
描述 |
|---|---|
none |
所有數列數據都會顯示單一 Y 軸。 這是預設值。 |
axes |
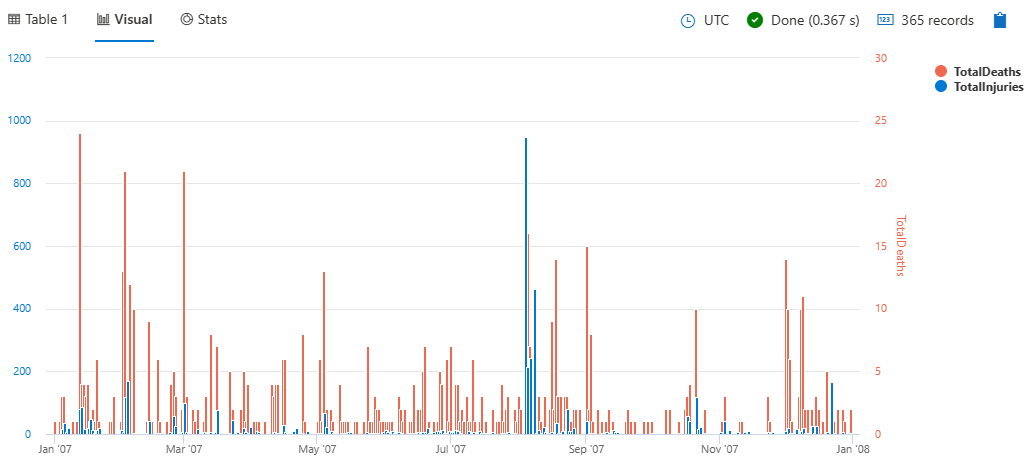
單一圖表會以多個 Y 軸顯示(每個數列一個)。 |
panels |
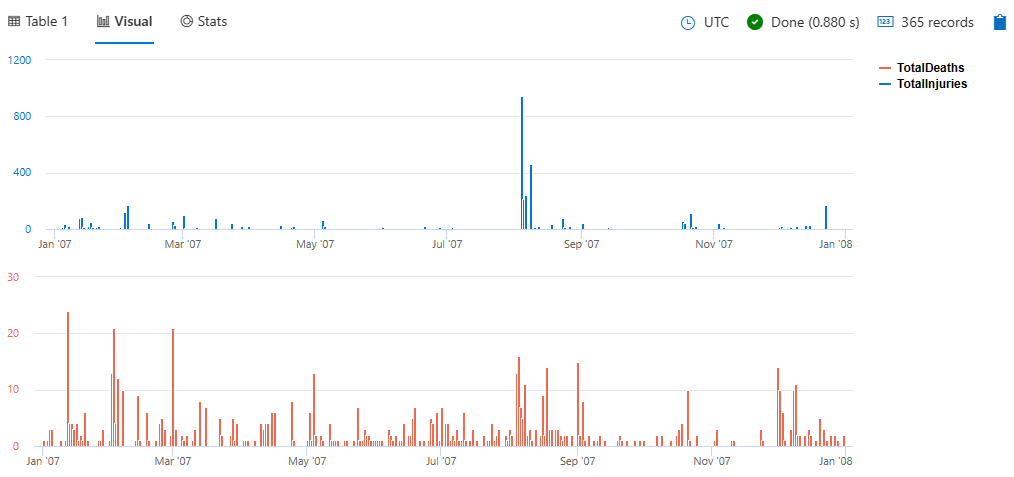
每個 ycolumn 值都會轉譯一張圖表。 |
支援的屬性
所有屬性都是選擇性的。
| PropertyName | PropertyValue |
|---|---|
kind |
進一步闡述視覺效果種類。 如需詳細資訊,請參閱 kind 屬性。 |
series |
以逗號分隔的數據行清單,其合併每個記錄值會定義記錄所屬的數位。 |
title |
視覺效果的標題(類型 string為 )。 |
kind 屬性
藉由提供 kind 屬性,即可進一步詳細說明此視覺效果。
此屬性的支援值為:
kind 值 |
定義 |
|---|---|
default |
每個「數據行」各自站立。 |
unstacked |
與 default 相同。 |
stacked |
堆疊 「columns」 一個頂端。 |
stacked100 |
堆疊 「數據行」,並將每個數據行伸展至與其他人相同的高度。 |
範例
轉譯柱形圖
StormEvents
| summarize event_count=count() by State
| where event_count > 10
| project State, event_count
| render columnchart
ysplit使用屬性
StormEvents
| summarize
    TotalInjuries = sum(InjuriesDirect) + sum(InjuriesIndirect),
    TotalDeaths = sum(DeathsDirect) + sum(DeathsIndirect)
    by bin(StartTime, 1d)
| project StartTime, TotalInjuries, TotalDeaths
| render columnchart with (ysplit=axes)
若要將檢視分割成不同的面板,請指定 panels 而非 axes:
StormEvents
| summarize
    TotalInjuries = sum(InjuriesDirect) + sum(InjuriesIndirect),
    TotalDeaths = sum(DeathsDirect) + sum(DeathsIndirect)
    by bin(StartTime, 1d)
| project StartTime, TotalInjuries, TotalDeaths
| render columnchart with (ysplit=panels)
範例
StormEvents
| summarize event_count=count() by State
| where event_count > 10
| project State, event_count
| render columnchart


