series_fit_poly_fl()
適用於: ✅Microsoft網狀架構✅Azure 數據總管
此函 series_fit_poly_fl() 式是 使用者定義函數 (UDF), 會在數列上套用多項式回歸。 此函式會採用包含多個數列的數據表(動態數值數位),並使用多項式回歸為每個數位產生最適合的高階多項式。 此函式會傳回多項式係數和數列範圍內的插補多項式。
注意
- 使用原生函 式 series_fit_poly() 而非本檔中所述的函式。 原生函式提供相同的功能,而且更適合效能和延展性。 本檔僅供參考之用。
- 對於平均間距數列的線性回歸,如make-series運算元所建立,請使用原生函式 series_fit_line() 。
必要條件
- 必須在 叢集上啟用 Python 外掛程式。 這是函式中使用的內嵌 Python 的必要專案。
語法
T | invoke series_fit_poly_fl(,,y_series y_fit_series fit_coeff,度, [ x_series ], [ x_istime ])
深入瞭解 語法慣例。
參數
| 姓名 | 類型 | 必要 | 描述 |
|---|---|---|---|
| y_series | string |
✔️ | 包含 相依變數的輸入資料表數據行名稱。 也就是說,要適應的系列。 |
| y_fit_series | string |
✔️ | 要儲存最適合數位的數據行名稱。 |
| fit_coeff | string |
✔️ | 要儲存最適合多項式係數的數據行名稱。 |
| 度 | int |
✔️ | 要符合多項式的必要順序。 例如,線性回歸 1、二次回歸 2 等。 |
| x_series | string |
包含 獨立變數的數據行名稱,也就是 x 或時間軸。 此參數是選擇性的,而且只需要不 平均間距的數列。 默認值是空字串,因為 x 是平均間距數列回歸的備援。 | |
| x_istime | bool |
只有在指定x_series,而且它是 datetime 的向量時,才需要此參數。 |
函式定義
您可以將函式的程式代碼內嵌為查詢定義的函式,或將其建立為資料庫中的預存函式,以定義函式,如下所示:
使用下列 let 語句來定義函式。 不需要任何權限。
let series_fit_poly_fl=(tbl:(*), y_series:string, y_fit_series:string, fit_coeff:string, degree:int, x_series:string='', x_istime:bool=False)
{
    let kwargs = bag_pack('y_series', y_series, 'y_fit_series', y_fit_series, 'fit_coeff', fit_coeff, 'degree', degree, 'x_series', x_series, 'x_istime', x_istime);
    let code = ```if 1:
        y_series = kargs["y_series"]
        y_fit_series = kargs["y_fit_series"]
        fit_coeff = kargs["fit_coeff"]
        degree = kargs["degree"]
        x_series = kargs["x_series"]
        x_istime = kargs["x_istime"]

        def fit(ts_row, x_col, y_col, deg):
            y = ts_row[y_col]
            if x_col == "": # If there is no x column creates sequential range [1, len(y)]
               x = np.arange(len(y)) + 1
            else: # if x column exists check whether its a time column. If so, normalize it to the [1, len(y)] range, else take it as is.
               if x_istime:
                   x = pd.to_numeric(pd.to_datetime(ts_row[x_col]))
                   x = x - x.min()
                   x = x / x.max()
                   x = x * (len(x) - 1) + 1
               else:
                   x = ts_row[x_col]
            coeff = np.polyfit(x, y, deg)
            p = np.poly1d(coeff)
            z = p(x)
            return z, coeff

        result = df
        if len(df):
           result[[y_fit_series, fit_coeff]] = df.apply(fit, axis=1, args=(x_series, y_series, degree,), result_type="expand")
    ```;
    tbl
     | evaluate python(typeof(*), code, kwargs)
};
// Write your query to use the function here.
範例
下列範例會使用 invoke 運算符 來執行 函式。
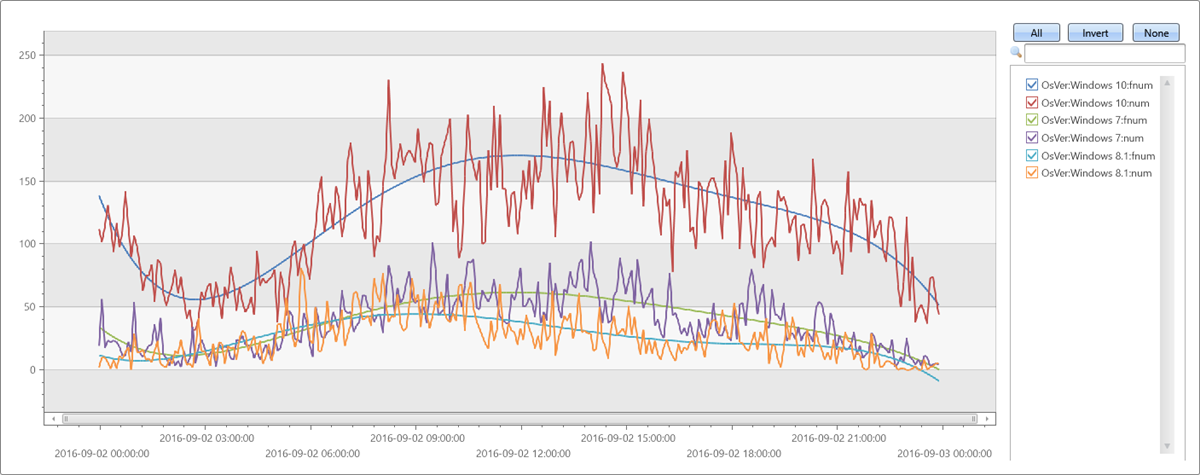
將第五個順序多項式調整為一般時間序列
若要使用查詢定義的函式,請在內嵌函數定義之後叫用它。
let series_fit_poly_fl=(tbl:(*), y_series:string, y_fit_series:string, fit_coeff:string, degree:int, x_series:string='', x_istime:bool=False)
{
    let kwargs = bag_pack('y_series', y_series, 'y_fit_series', y_fit_series, 'fit_coeff', fit_coeff, 'degree', degree, 'x_series', x_series, 'x_istime', x_istime);
    let code = ```if 1:
        y_series = kargs["y_series"]
        y_fit_series = kargs["y_fit_series"]
        fit_coeff = kargs["fit_coeff"]
        degree = kargs["degree"]
        x_series = kargs["x_series"]
        x_istime = kargs["x_istime"]

        def fit(ts_row, x_col, y_col, deg):
            y = ts_row[y_col]
            if x_col == "": # If there is no x column creates sequential range [1, len(y)]
               x = np.arange(len(y)) + 1
            else: # if x column exists check whether its a time column. If so, normalize it to the [1, len(y)] range, else take it as is.
               if x_istime:
                   x = pd.to_numeric(pd.to_datetime(ts_row[x_col]))
                   x = x - x.min()
                   x = x / x.max()
                   x = x * (len(x) - 1) + 1
               else:
                   x = ts_row[x_col]
            coeff = np.polyfit(x, y, deg)
            p = np.poly1d(coeff)
            z = p(x)
            return z, coeff

        result = df
        if len(df):
           result[[y_fit_series, fit_coeff]] = df.apply(fit, axis=1, args=(x_series, y_series, degree,), result_type="expand")
    ```;
    tbl
     | evaluate python(typeof(*), code, kwargs)
};
//
// Fit fifth order polynomial to a regular (evenly spaced) time series, created with make-series
//
let max_t = datetime(2016-09-03);
demo_make_series1
| make-series num=count() on TimeStamp from max_t-1d to max_t step 5m by OsVer
| extend fnum = dynamic(null), coeff=dynamic(null), fnum1 = dynamic(null), coeff1=dynamic(null)
| invoke series_fit_poly_fl('num', 'fnum', 'coeff', 5)
| render timechart with(ycolumns=num, fnum)
輸出
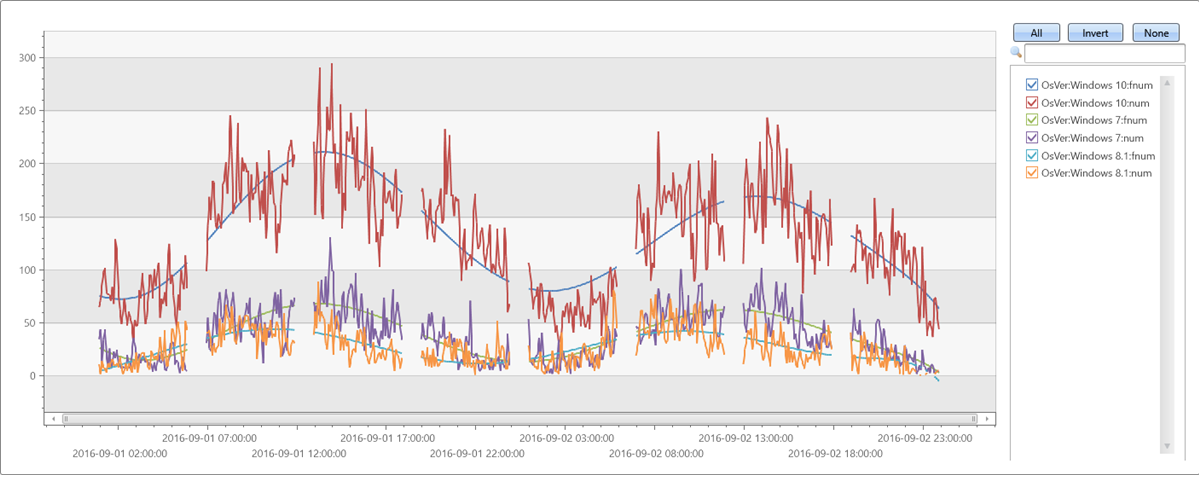
測試不規則的時間序列
若要使用查詢定義的函式,請在內嵌函數定義之後叫用它。
let series_fit_poly_fl=(tbl:(*), y_series:string, y_fit_series:string, fit_coeff:string, degree:int, x_series:string='', x_istime:bool=False)
{
    let kwargs = bag_pack('y_series', y_series, 'y_fit_series', y_fit_series, 'fit_coeff', fit_coeff, 'degree', degree, 'x_series', x_series, 'x_istime', x_istime);
    let code = ```if 1:
        y_series = kargs["y_series"]
        y_fit_series = kargs["y_fit_series"]
        fit_coeff = kargs["fit_coeff"]
        degree = kargs["degree"]
        x_series = kargs["x_series"]
        x_istime = kargs["x_istime"]

        def fit(ts_row, x_col, y_col, deg):
            y = ts_row[y_col]
            if x_col == "": # If there is no x column creates sequential range [1, len(y)]
               x = np.arange(len(y)) + 1
            else: # if x column exists check whether its a time column. If so, normalize it to the [1, len(y)] range, else take it as is.
               if x_istime:
                   x = pd.to_numeric(pd.to_datetime(ts_row[x_col]))
                   x = x - x.min()
                   x = x / x.max()
                   x = x * (len(x) - 1) + 1
               else:
                   x = ts_row[x_col]
            coeff = np.polyfit(x, y, deg)
            p = np.poly1d(coeff)
            z = p(x)
            return z, coeff

        result = df
        if len(df):
           result[[y_fit_series, fit_coeff]] = df.apply(fit, axis=1, args=(x_series, y_series, degree,), result_type="expand")
    ```;
    tbl
     | evaluate python(typeof(*), code, kwargs)
};
let max_t = datetime(2016-09-03);
demo_make_series1
| where TimeStamp between ((max_t-2d)..max_t)
| summarize num=count() by bin(TimeStamp, 5m), OsVer
| order by TimeStamp asc
| where hourofday(TimeStamp) % 6 != 0   //  delete every 6th hour to create unevenly spaced time series
| summarize TimeStamp=make_list(TimeStamp), num=make_list(num) by OsVer
| extend fnum = dynamic(null), coeff=dynamic(null)
| invoke series_fit_poly_fl('num', 'fnum', 'coeff', 8, 'TimeStamp', True)
| render timechart with(ycolumns=num, fnum)
輸出
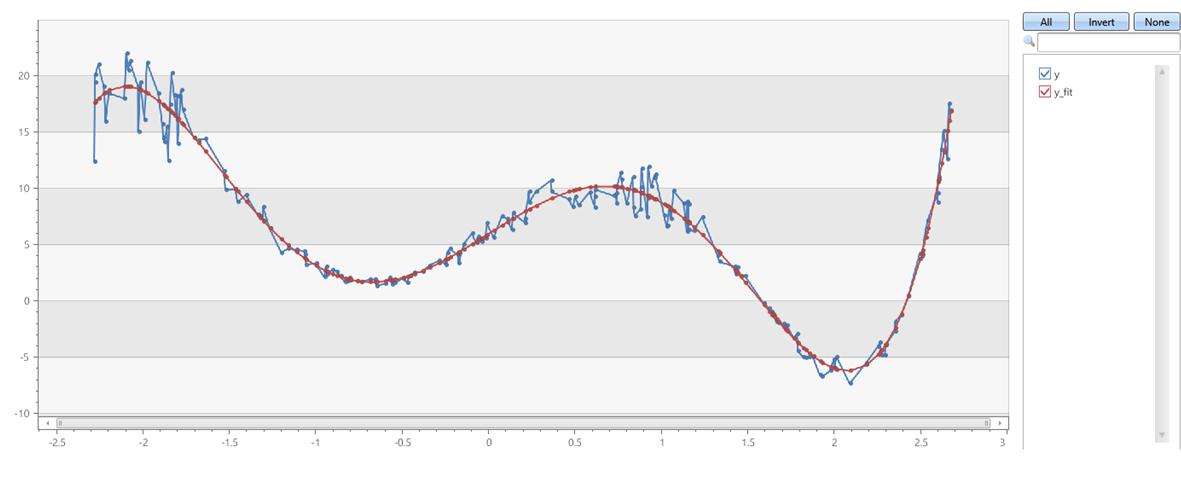
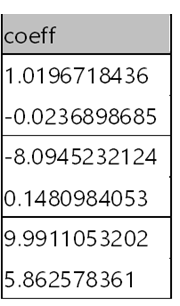
x 和 y 軸上具有雜訊的第五個順序多項式
若要使用查詢定義的函式,請在內嵌函數定義之後叫用它。
let series_fit_poly_fl=(tbl:(*), y_series:string, y_fit_series:string, fit_coeff:string, degree:int, x_series:string='', x_istime:bool=False)
{
    let kwargs = bag_pack('y_series', y_series, 'y_fit_series', y_fit_series, 'fit_coeff', fit_coeff, 'degree', degree, 'x_series', x_series, 'x_istime', x_istime);
    let code = ```if 1:
        y_series = kargs["y_series"]
        y_fit_series = kargs["y_fit_series"]
        fit_coeff = kargs["fit_coeff"]
        degree = kargs["degree"]
        x_series = kargs["x_series"]
        x_istime = kargs["x_istime"]

        def fit(ts_row, x_col, y_col, deg):
            y = ts_row[y_col]
            if x_col == "": # If there is no x column creates sequential range [1, len(y)]
               x = np.arange(len(y)) + 1
            else: # if x column exists check whether its a time column. If so, normalize it to the [1, len(y)] range, else take it as is.
               if x_istime:
                   x = pd.to_numeric(pd.to_datetime(ts_row[x_col]))
                   x = x - x.min()
                   x = x / x.max()
                   x = x * (len(x) - 1) + 1
               else:
                   x = ts_row[x_col]
            coeff = np.polyfit(x, y, deg)
            p = np.poly1d(coeff)
            z = p(x)
            return z, coeff

        result = df
        if len(df):
           result[[y_fit_series, fit_coeff]] = df.apply(fit, axis=1, args=(x_series, y_series, degree,), result_type="expand")
    ```;
    tbl
     | evaluate python(typeof(*), code, kwargs)
};
range x from 1 to 200 step 1
| project x = rand()*5 - 2.3
| extend y = pow(x, 5)-8*pow(x, 3)+10*x+6
| extend y = y + (rand() - 0.5)*0.5*y
| summarize x=make_list(x), y=make_list(y)
| extend y_fit = dynamic(null), coeff=dynamic(null)
| invoke series_fit_poly_fl('y', 'y_fit', 'coeff', 5, 'x')
|fork (project-away coeff) (project coeff | mv-expand coeff)
| render linechart
輸出