Ad-hoc analysis of inventory data
This article explains how to use the Data Analysis feature to analyze inventory data directly from list pages and queries. You don't have to run a report or switch to another application, such as Excel. The feature provides an interactive and versatile way to calculate, summarize, and examine data. Instead of running reports using options and filters, you can add multiple tabs that represent different tasks or views on the data. Some examples are "expiring stock" or "top sellers," or any other view you can imagine. To learn more about how to use the Data Analysis feature, go to Analyze list and query data with analysis mode.
Use the following list pages for ad-hoc analysis of inventory processes:
Inventory ad-hoc analysis scenarios
Use the Data Analysis feature for quick fact checking and ad-hoc analysis:
- If you don't want to run a report.
- If a report for your specific need doesn't exist.
- If you want to quickly iterate to get a good overview on a part of your business.
The following sections provide examples of inventory scenarios in Business Central.
| Area | To... | Open this page in analysis mode | Using these fields |
|---|---|---|---|
| Inventory on-hand | Get an overview of items that are available in your inventory. | Item Ledger Entries | Item No., Remaining Quantity |
| Example: track expiring or old stock | Get an overview of items in your inventory that have been on stock for a long time and aren't selling well. | Item Ledger Entries | Posting Date Year, Posting Date Month, Item No., Posting Date, Entry type, Quantity, and Remaining Quantity. |
| Returned items by return reason | Get an overview of goods that customers return, categorized by the return reason. Use this for analysis for quality control. | Item Ledger Entries | Return Reason Code, Posting Date Month, Quantity , Cost Amount, Posting Date, Document Type, Item No., and Document No. . |
| Inventory throughput | Get an overview of purchases and sales in your inventory by month or quarter. | Item Ledger Entries | Posting Date Year, Posting Date Month, Item No., Quantity, Sales Amount, Cost Amount (Actual), and Posting Date Month |
| [Inventory movements] | Get an overview of how goods in your inventory move between locations. | Item Ledger Entries | Location Code, Quantity, Posting Date, Item No. |
Example: inventory on-hand
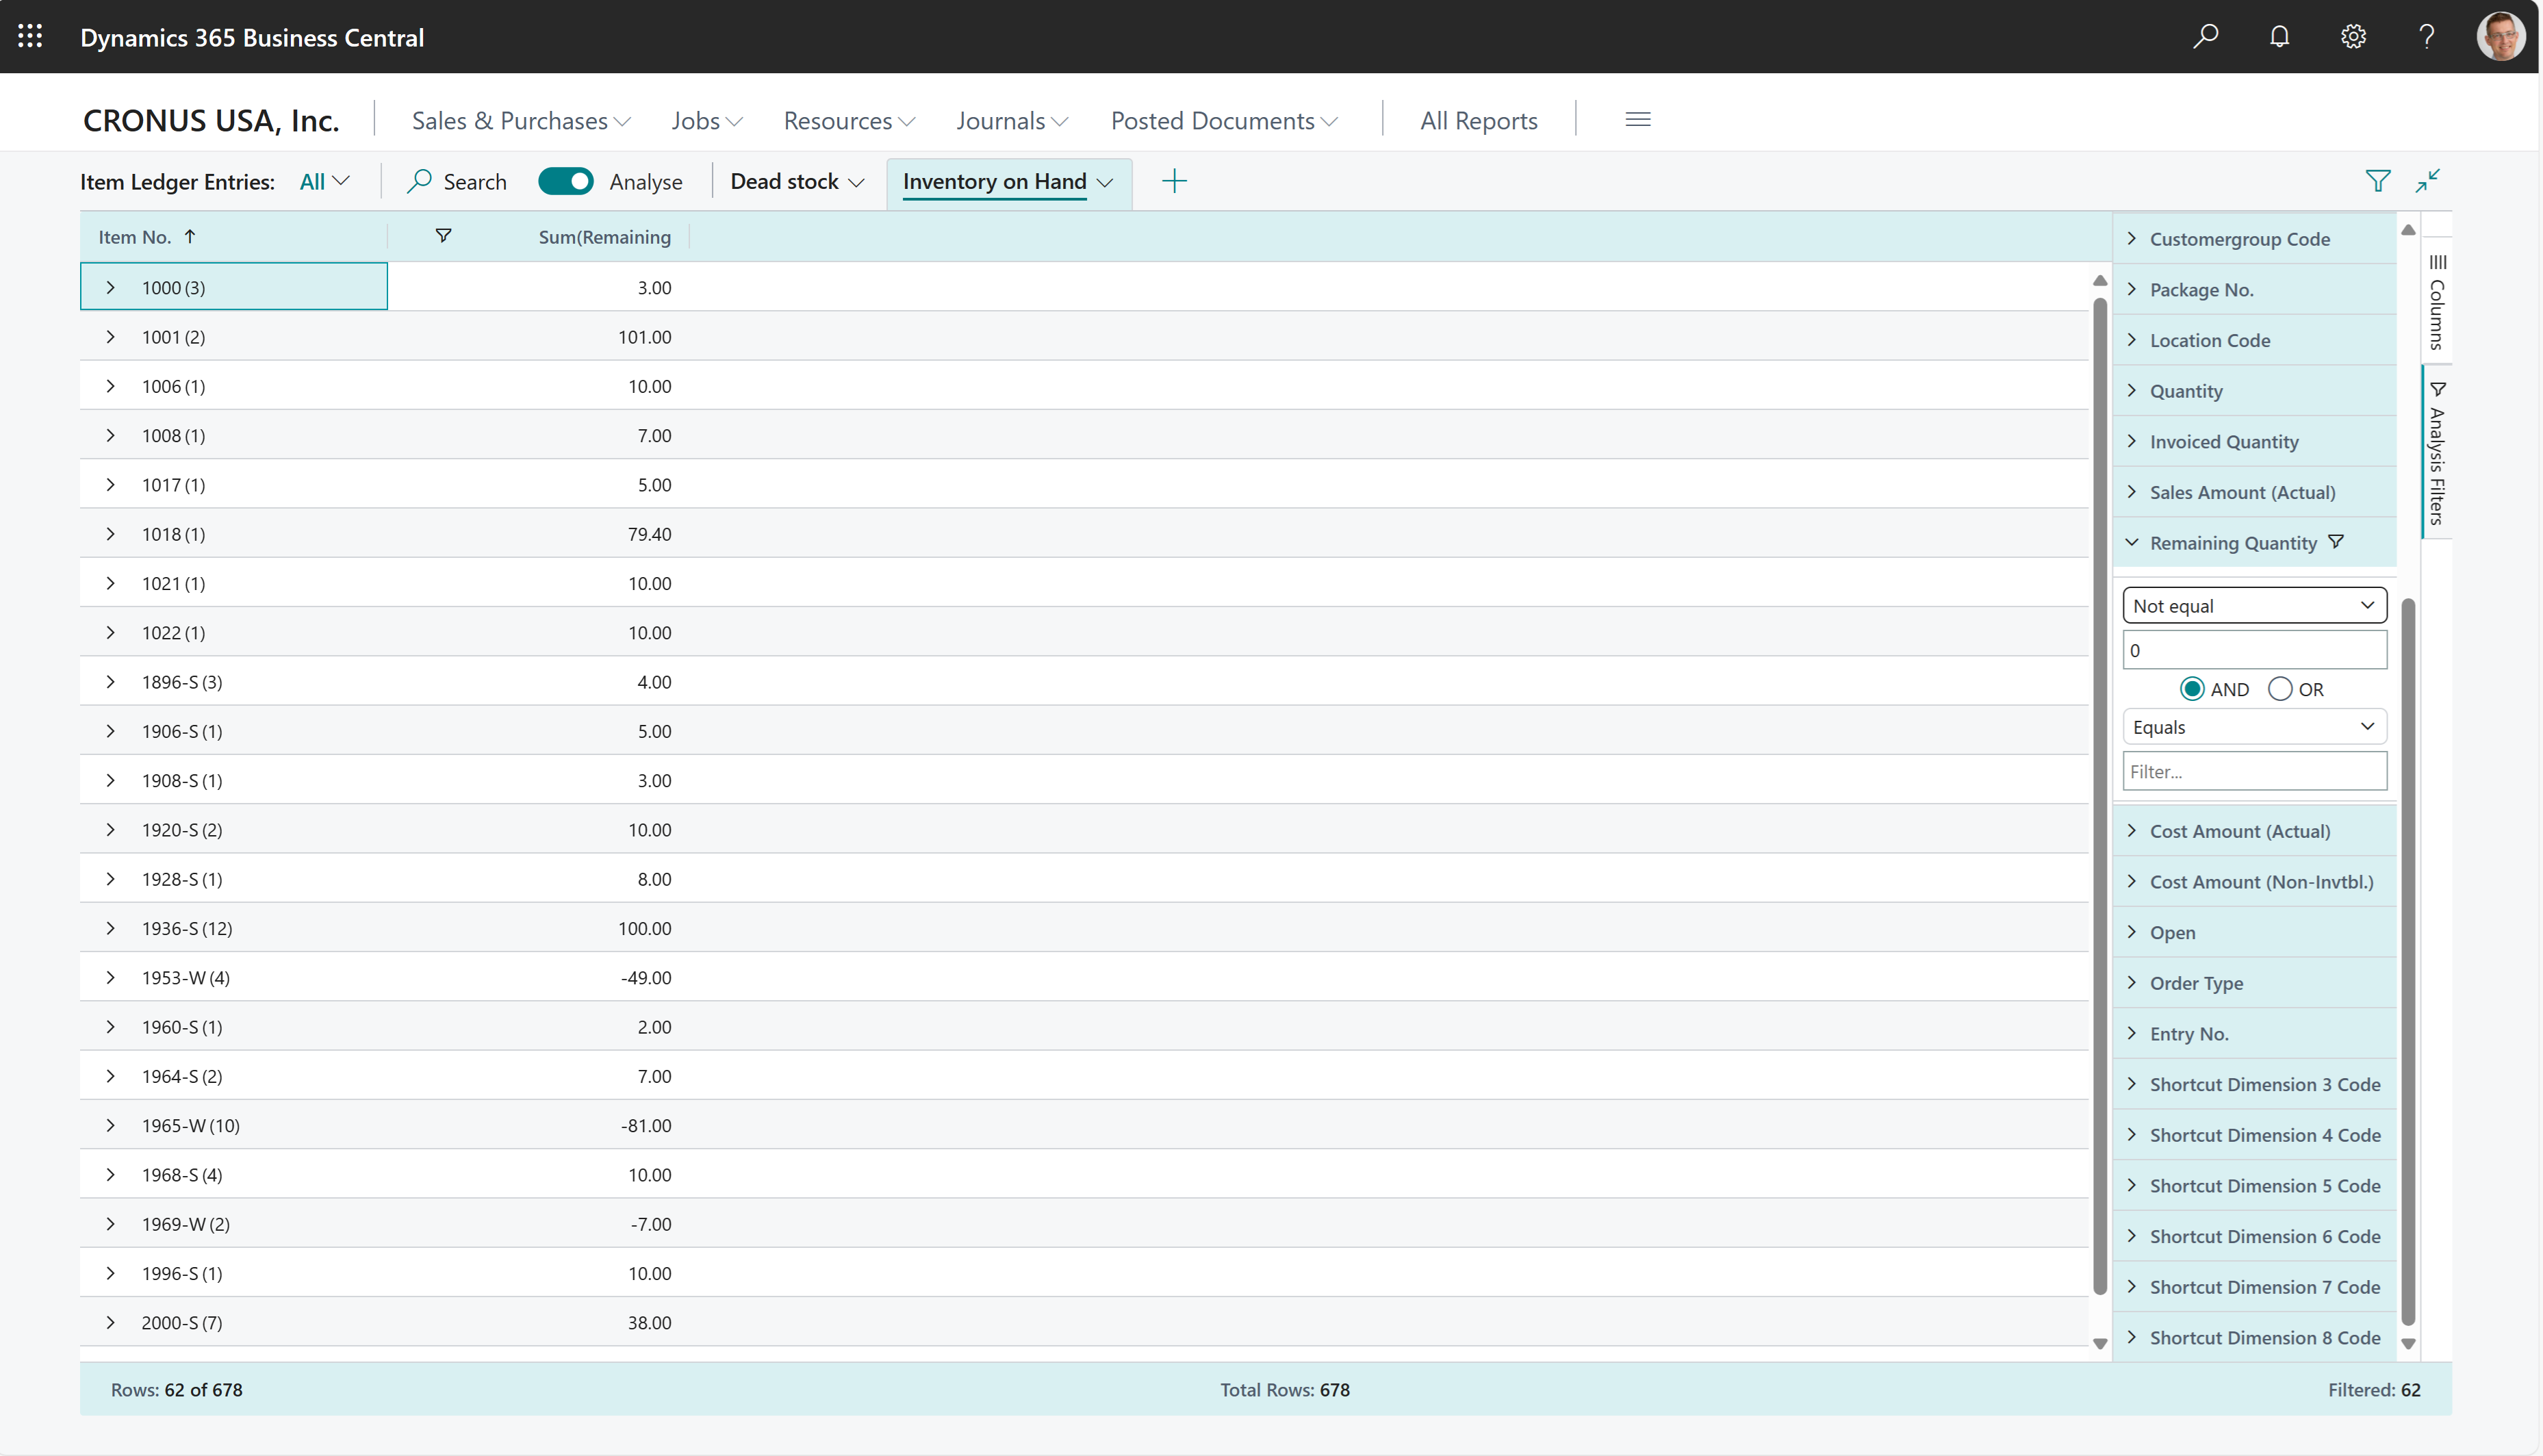
To analyze items in your inventory that are in stock, follow these steps:
- Open the Item Ledger Entries list, and choose
 to turn on analysis mode.
 - Go to the Columns menu and remove all columns (select the box next to the Search field).
- Drag the Item No. field to the Row Groups area. Drag the fields in that order.
- Drag the field Remaining Quantity to the Values ares.
- Set a Not equal filter to 0 on Remaining Quantity. If you don't allow negative stock levels, set a Greater than filter to 0.
- Optionally, add other fields to the analysis and maybe pivot on location or other fields.
- Rename your analysis tab to Inventory on Hand or something that describes this analysis.
The following image shows the result of these steps.
Example: track expiring or old stock
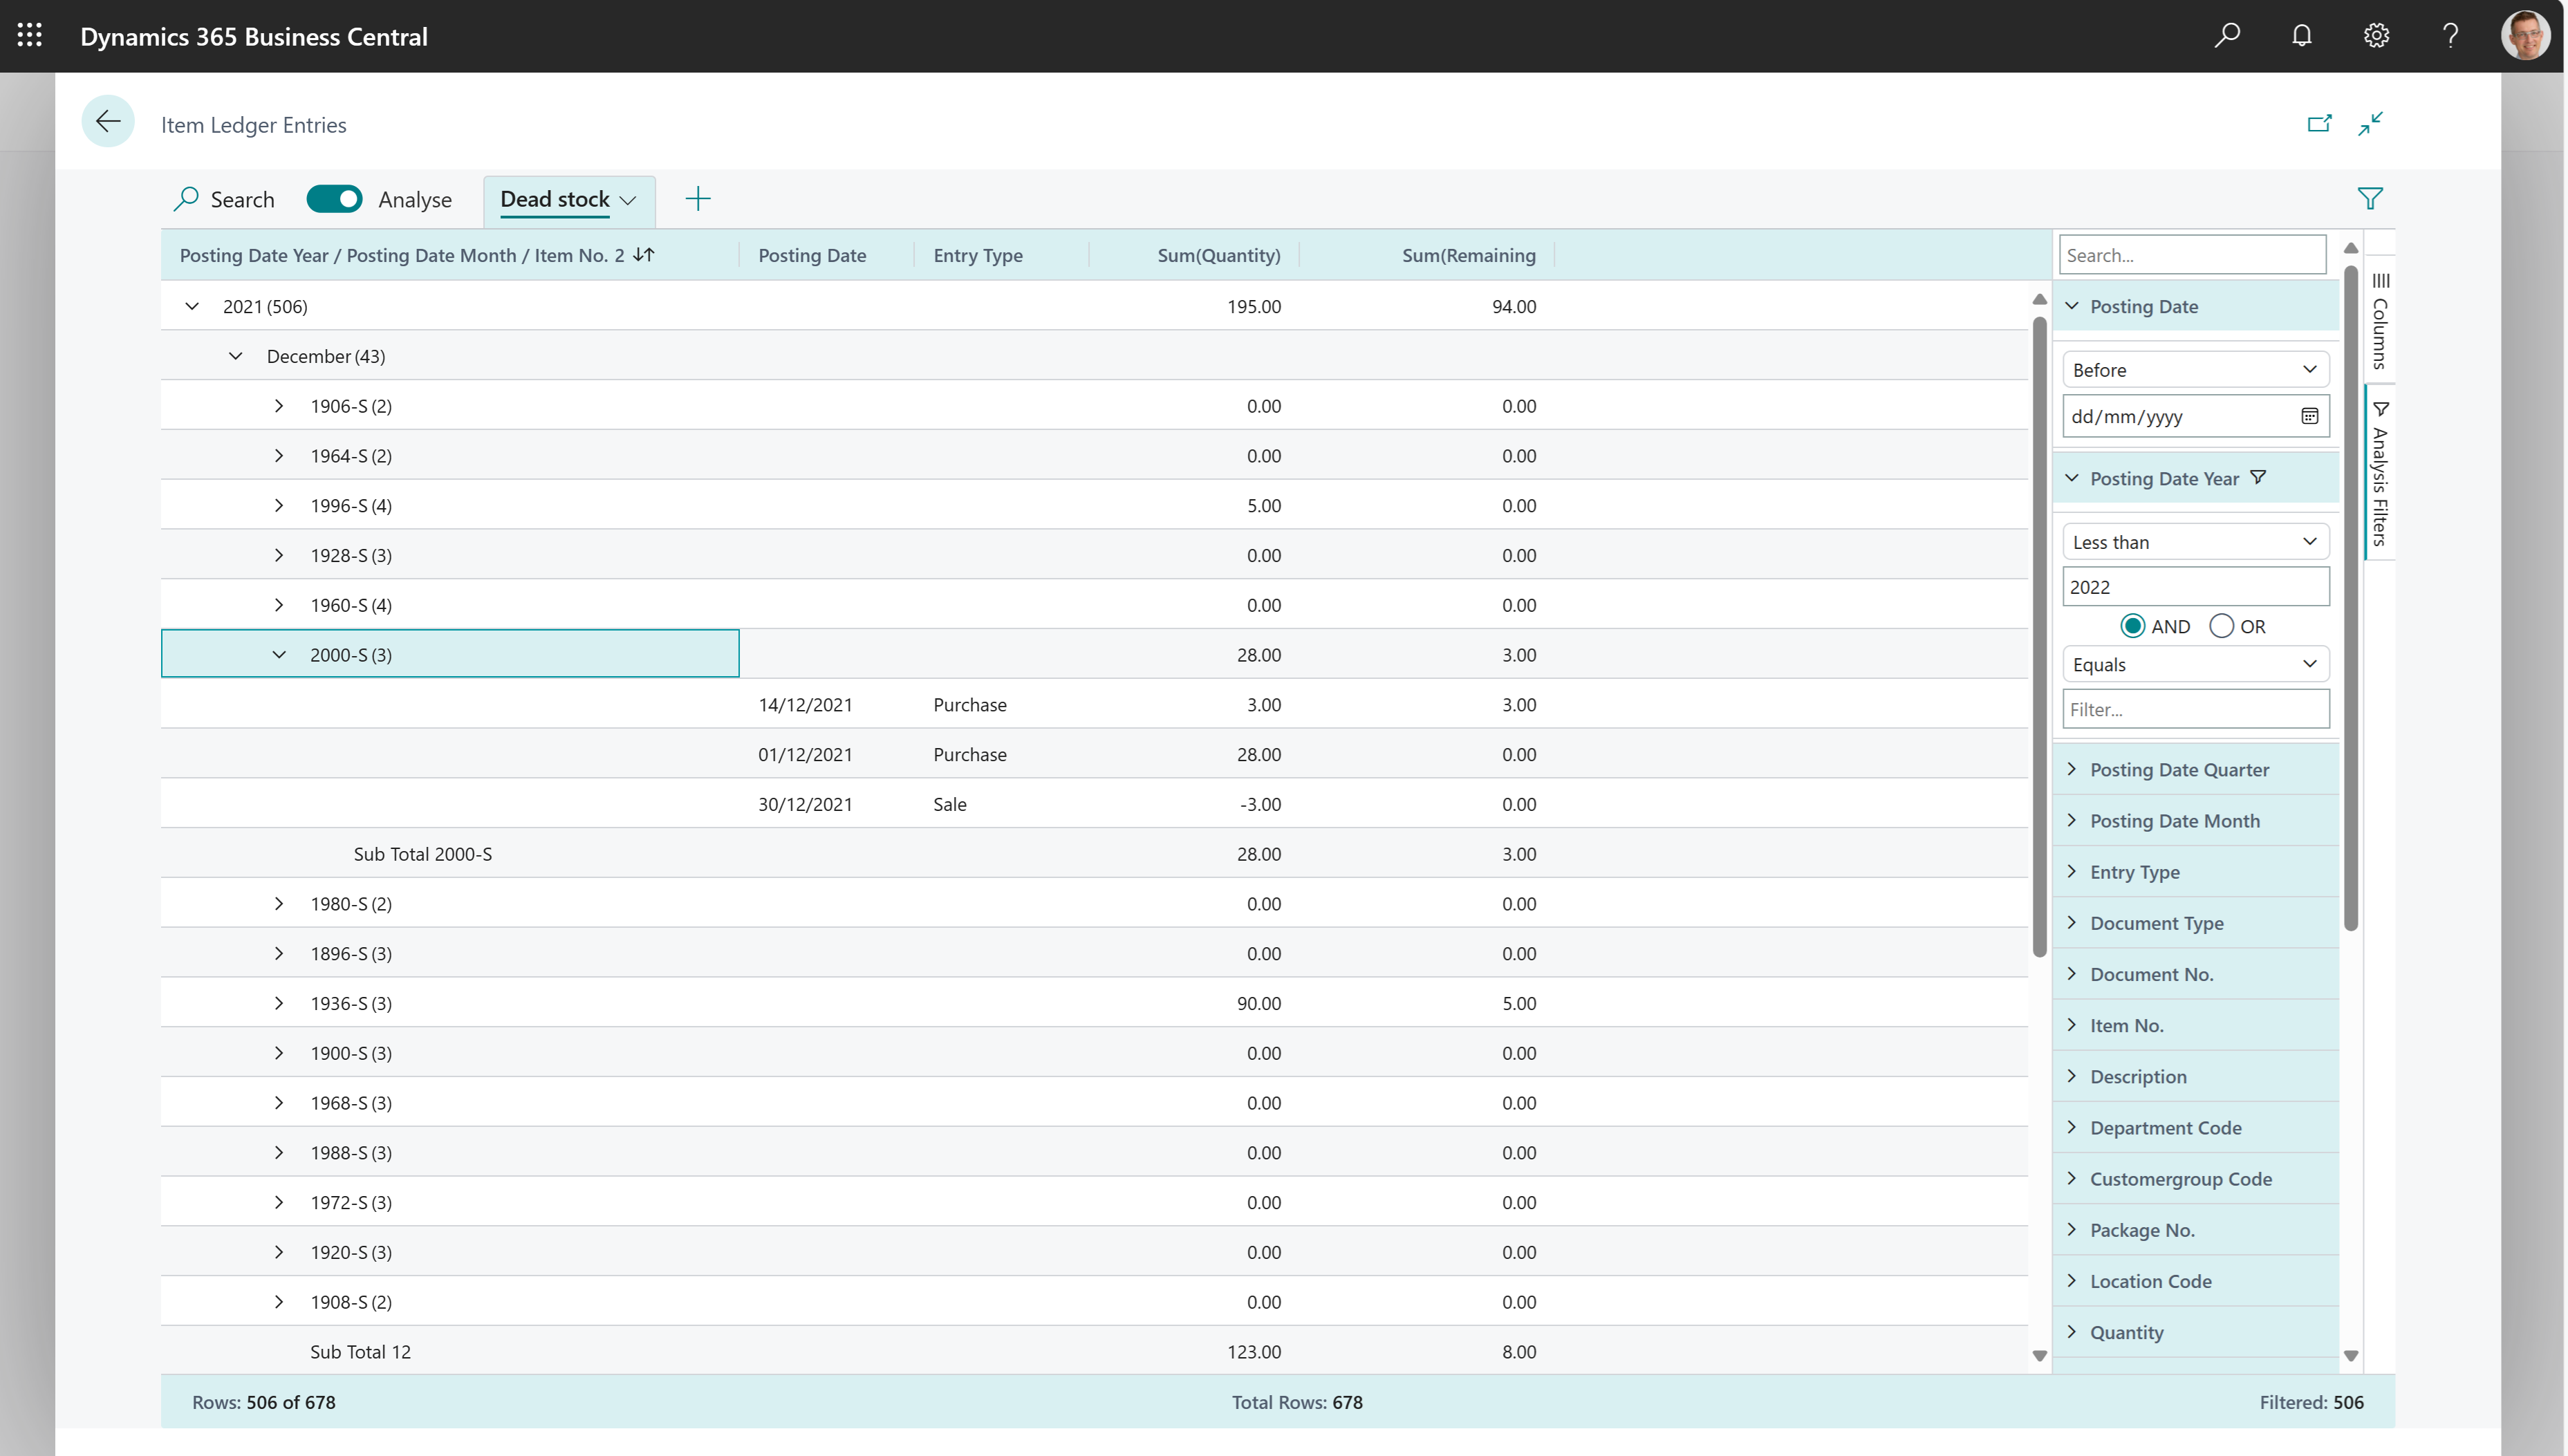
To analyze items in your inventory that have been on stock for a long time and aren't selling well, follow these steps:
- Open the Item Ledger Entries list, and choose
 to turn on analysis mode.
 - Go to the Columns menu and remove all columns (select the box next to the Search field on the right).
- Drag the Posting Date Year, Posting Date Month and Item No. fields to the Row Groups area. Drag the fields in that order.
- In the Columns area, choose the Posting Date, Entry type, Quantity, and Remaining Quantity fields.
- Set a Less than filter to Posting Date to define what you mean by "old".
- Rename your analysis tab to Old stock or something that describes this analysis.
The following image shows the result of these steps.
Example: returned items by return reason
To analyze returned items sorted by the reasons for their return, follow these steps:
- Open the Item Ledger Entries list.
- Add the Return Reason Code field by personalizing the page. On the Settings menu, choose Personalize.
- Exit personalization mode.
- Choose
 to turn on analysis mode.
 - Go to the Columns menu and remove all columns (select the box next to the Search field on the right).
- Drag the Return Reason Code and Posting Date Month fields to the Row Groups area. Drag the fields in that order.
- Drag the Quantity and Cost Amount fields to the Values area.
- Add any other fields that you want in the analysis, and enable them in the Columns area. For example, you might add the Posting Date, Document Type, Item No., and Document No. fields.
- Rename your analysis tab to Returned items by return reason or something that describes this analysis.
Example: inventory throughput
- Open the Item Ledger Entries list, and choose
 to turn on analysis mode.
 - Go to the Columns menu and remove all columns (select the box next to the Search field on the right).
- Turn on the Pivot Mode toggle (located above the Search field on the right).
- Drag the Posting Date Year, Posting Date Month, and Item No. fields to the Row Groups area.
- Drag the Quantity, Sales Amount, and Cost Amount (Actual) fields to the Values area.
- Drag the Posting Date Month field to the Column Groups area.
- Rename your analysis tab to Inventory throughput by Month or something that describes this analysis.
Inventory movements
To track inventory movements between locations, follow these steps:
Open the Item Ledger Entries list, and choose
 to turn on analysis mode.
Go to the Columns menu and remove all columns (select the box next to the Search field on the right).
Drag the Location Code field to the Row Groups area.
Drag the Quantity field to the Values area.
Add any other fields that you want in the analysis, and enable them in the Columns area. For example, you might add the Item No. field.
Rename your analysis tab to Inventory movements or something that describes this analysis.
Tip
If you add the Posting Date field, you can also track movements over time.
Data foundation for ad-hoc analysis on inventory
When you post a sales order, Business Central updates the customer's account, general ledger, and item ledger entries.
- For each sales order line, an item ledger entry is created in the Item Ledger Entry table (if the sales lines contain item numbers). In addition, sales orders are always recorded in the Sales Shipment Header and Sales Invoice Header tables. To learn more about posting sales, go to Posting sales.
When you post a purchase document, Business Central updates the vendor's account, general ledger (G/L), item ledger entries, and resource ledger entries.
- For each purchase line, as applicable, entries are created in the Item Ledger Entry table (if the purchase line is of the Item type). In addition, purchase documents are always recorded in the Purch. Recpt. Header and Purch. Inv. Header tables. To learn more, go to Posting purchases.
See also
Analyze list and query data with analysis mode
Inventory analytics overview
Analytics, business intelligence, and reporting overview
Inventory overview
Work with Business Central

