透過 Azure 監視器記錄監視 Site Recovery
本文說明如何使用 Azure 監視器記錄和 Log Analytics 來監視 Azure Site Recovery 所複寫的機器。
Azure 監視器記錄檔會提供記錄資料平台,以收集活動和資源記錄,以及其他監視資料。 在 Azure 監視器記錄中,您可以使用 Log Analytics 來撰寫和測試記錄查詢,並且以互動方式分析記錄資料。 您可以將記錄結果視覺化並進行查詢,並設定警示以根據受監視的資料採取動作。
針對 Site Recovery,您可以使用 Azure 監視器記錄來協助執行下列作業:
- 監視 Site Recovery 健康情況和狀態。 例如,您可以監視複寫健康情況、測試容錯移轉狀態、Site Recovery 事件、受保護機器的復原點目標 (RPO),以及磁碟/資料變更率。
- 設定 Site Recovery 的警示。 例如,您可以設定電腦健康情況、測試容錯移轉狀態或 Site Recovery 作業狀態的警示。
針對 Azure 至 Azure 的複寫,以及將 VMware 虛擬機器/實體伺服器複寫到 Azure,都支援搭配使用 Azure 監視器記錄與 Site Recovery。
注意
若要取得 VMware 和實體機器的變換資料記錄和上傳率記錄,您需要在處理序伺服器上安裝 Microsoft Monitoring Agent。 此代理程式會將複寫機器的記錄傳送至工作區。 這項功能僅適用於 9.30 的行動代理程式版本。
必要條件
以下是所需項目:
- 在復原服務保存庫中至少有一部機器受到保護。
- 用於儲存 Site Recovery 記錄的 Log Analytics 工作區。 瞭解如何設定工作區。
- 如何在 Log Analytics 中撰寫、執行及分析記錄查詢的基本知識。 深入了解。
在開始之前,建議您先複習常見的監視問題。
Azure Site Recovery 可用的事件記錄
Azure Site Recovery 提供下列資源特定和舊版資料表。 每個事件都會提供一組特定站台復原相關成品的詳細資料。
資源專屬資料表:
舊版資料表:
- Azure Site Recovery 事件
- Azure Site Recovery 複寫項目
- Azure Site Recovery 複寫統計資料
- Azure Site Recovery 點
- Azure Site Recovery 複寫資料上傳速率
- Azure Site Recovery 受保護的磁碟資料變換
- Azure Site Recovery 複寫的項目詳細資料
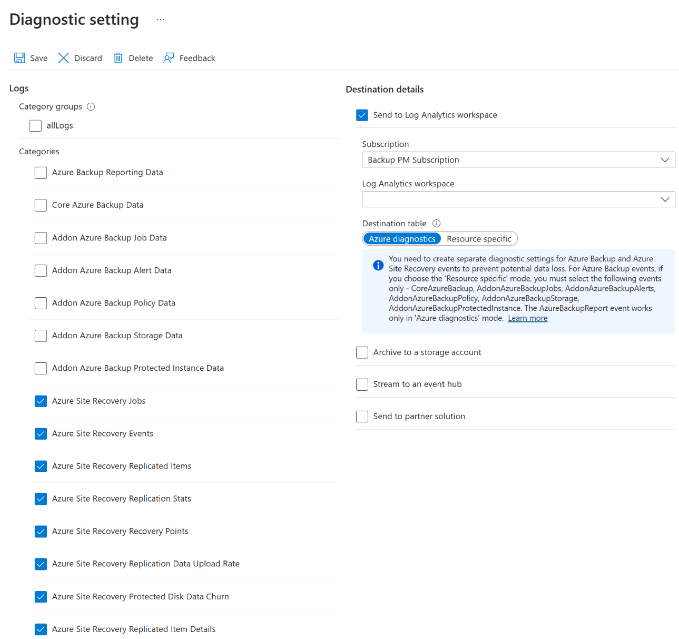
設定 Site Recovery 以傳送記錄
在保存庫中,選取 [診斷設定]>[新增診斷設定]。
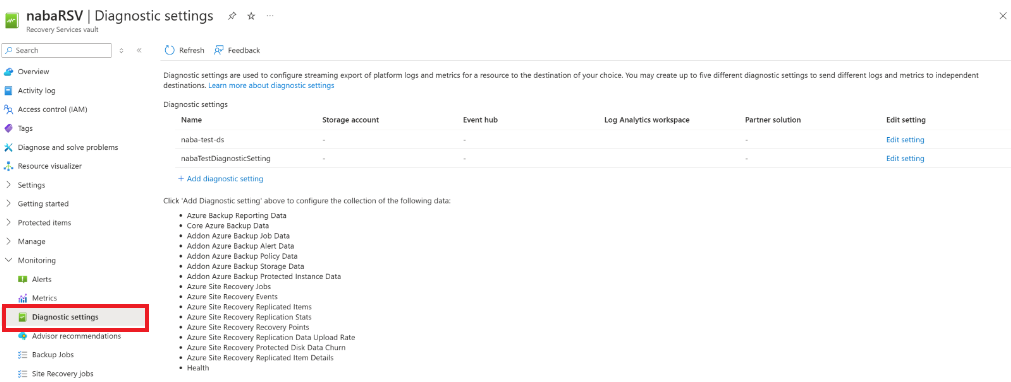
在 [診斷設定] 中指定名稱,然後勾選 [傳送至 Log Analytics] 方塊。
選取 [Azure 監視器記錄] 訂用帳戶和 Log Analytics 工作區。
選取切換中的 [Azure 診斷]。
從記錄清單中,選取前置詞為 AzureSiteRecovery 的所有記錄。 然後選取確定。
Site Recovery 記錄開始送入所選工作區中的資料表 (AzureDiagnostics)。
在處理序伺服器上設定 Microsoft Monitoring Agent,以傳送變換和上傳率記錄
您可以在內部部署中,為您的 VMware/實體機器擷取資料變換率資訊和來源資料上傳速率資訊。 若要啟用此功能,必須在處理序伺服器上安裝 Microsoft Monitoring Agent。
移至 Log Analytics 工作區,然後選取 [Advanced 設定]。
選取 [連接的來源] 頁面,然後再選取 [Windows 伺服器]。
在處理序伺服器上下載 Windows 代理程式 (64 位元)。
藉由提供取得的工作區識別碼和金鑰來完成代理程式安裝。
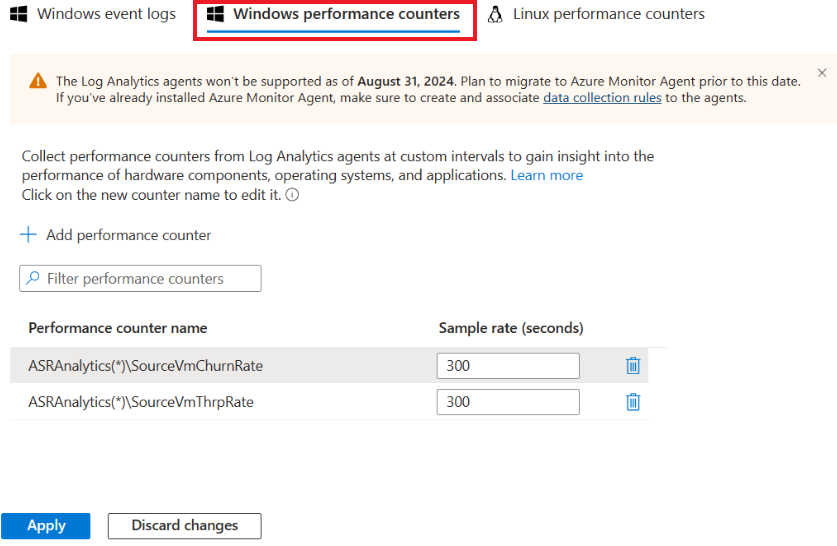
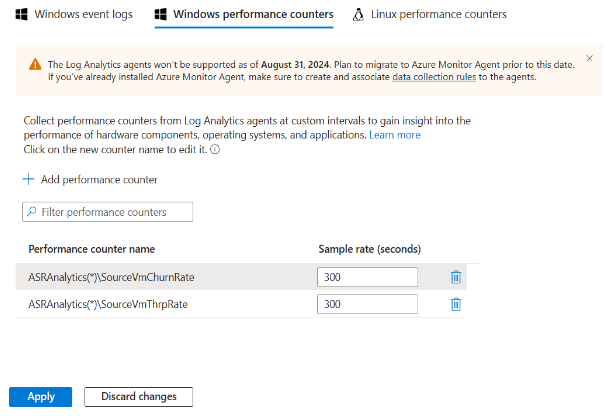
安裝完成之後,請移至 Log Analytics 工作區,然後選取 [舊版代理程式管理]。 移至 [資料] 頁面,然後選取 [Windows 效能計數器]。
選取 [+] 以新增下列兩個取樣間隔為 300 秒的計數器:
- ASRAnalytics(*)\SourceVmChurnRate
- ASRAnalytics(*)\SourceVmThrpRate
變換和上傳率資料會開始送入工作區。
目前無法搜尋下列 Site Recovery 計數器:
- ASRAnalytics(*)\SourceVmChurnRate
- ASRAnalytics(*)\SourceVmThrpRate
不過,您可以透過完整貼上名稱來新增它們。
注意
目前您無法搜尋這些計數器。 不過,您可以複製並貼上其完整名稱來新增它們。
- SourceVmThrpRate 透過在來源上放置速率來顯示網路。
- SourceVmChurnRate 會在來源虛擬機的磁碟上顯示數據變更率。
查詢記錄 - 範例
您可以使用以 Kusto 查詢語言撰寫的記錄查詢,從記錄檔中取出資料。 本節提供一些範例,說明您可能用於 Site Recovery 監視的常見查詢。
注意
部分範例使用 replicationProviderName_s 設定為 A2A。 這會使用 Site Recovery 來抓取複寫至次要 Azure 區域的 Azure 虛擬機器。 在這些範例中,如果您想要使用 Site Recovery 來抓取複寫到 Azure 的內部部署 VMware 虛擬機器或實體伺服器,您可以將 A2A 取代為 InMageRcm。
查詢複寫健康情況
此查詢會繪製圓形圖,以瞭解所有受保護 Azure 虛擬機器目前的複寫健康情況,分為三種狀態:正常、警告或嚴重。
AzureDiagnostics
| where replicationProviderName_s == "A2A"
| where isnotempty(name_s) and isnotnull(name_s)
| summarize hint.strategy=partitioned arg_max(TimeGenerated, *) by name_s
| project name_s , replicationHealth_s
| summarize count() by replicationHealth_s
| render piechart
查詢行動服務版本
此查詢會繪製使用 Site Recovery 複寫的 Azure 虛擬機器圓形圖,並依其執行的行動代理程式版本細分。
AzureDiagnostics
| where replicationProviderName_s == "A2A"
| where isnotempty(name_s) and isnotnull(name_s)
| summarize hint.strategy=partitioned arg_max(TimeGenerated, *) by name_s
| project name_s , agentVersion_s
| summarize count() by agentVersion_s
| render piechart
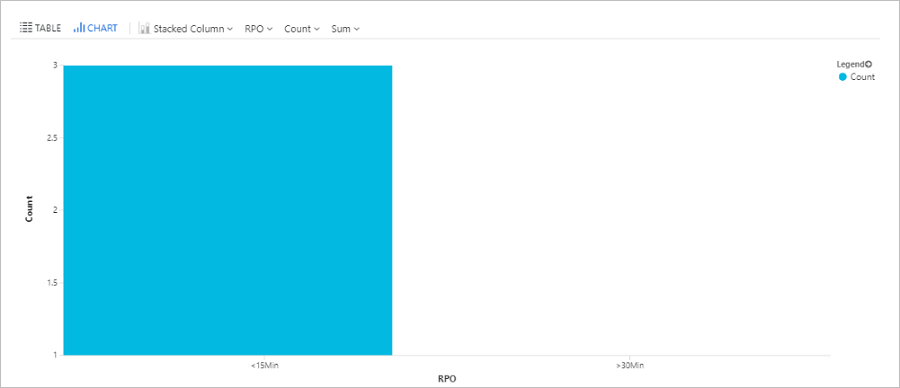
查詢 RPO 時間
此查詢會繪製使用 Site Recovery 所複寫的 Azure 虛擬機器橫條圖,並依復原點目標 (RPO) 細分:少於 15 分鐘、介於 15-30 分鐘之間、超過 30 分鐘。
AzureDiagnostics
| where replicationProviderName_s == "A2A"
| where isnotempty(name_s) and isnotnull(name_s)
| extend RPO = case(rpoInSeconds_d <= 900, "<15Min",
rpoInSeconds_d <= 1800, "15-30Min", ">30Min")
| summarize hint.strategy=partitioned arg_max(TimeGenerated, *) by name_s
| project name_s , RPO
| summarize Count = count() by RPO
| render barchart
查詢 Site Recovery 作業
此查詢會 (針對所有災害復原案例) 擷取過去 72 小時內觸發的所有 Site Recovery 作業,以及其完成狀態。
AzureDiagnostics
| where Category == "AzureSiteRecoveryJobs"
| where TimeGenerated >= ago(72h)
| project JobName = OperationName , VaultName = Resource , TargetName = affectedResourceName_s, State = ResultType
查詢 Site Recovery 事件
此查詢會 (針對所有災害復原案例) 擷取所有過去 72 小時內引發的 Site Recovery 作業,以及其嚴重性。
AzureDiagnostics
| where Category == "AzureSiteRecoveryEvents"
| where TimeGenerated >= ago(72h)
| project AffectedObject=affectedResourceName_s , VaultName = Resource, Description_s = healthErrors_s , Severity = Level
查詢測試容錯移轉狀態 (圓形圖)
此查詢會繪製以 Site Recovery 複寫的 Azure 虛擬機器測試容錯移轉狀態圓形圖。
AzureDiagnostics
| where replicationProviderName_s == "A2A"
| where isnotempty(name_s) and isnotnull(name_s)
| where isnotempty(failoverHealth_s) and isnotnull(failoverHealth_s)
| summarize hint.strategy=partitioned arg_max(TimeGenerated, *) by name_s
| project name_s , Resource, failoverHealth_s
| summarize count() by failoverHealth_s
| render piechart
查詢測試容錯移轉狀態 (資料表)
此查詢會繪製以 Site Recovery 複寫的 Azure 虛擬機器測試容錯移轉狀態表格。
AzureDiagnostics
| where replicationProviderName_s == "A2A"
| where isnotempty(name_s) and isnotnull(name_s)
| where isnotempty(failoverHealth_s) and isnotnull(failoverHealth_s)
| summarize hint.strategy=partitioned arg_max(TimeGenerated, *) by name_s
| project VirtualMachine = name_s , VaultName = Resource , TestFailoverStatus = failoverHealth_s
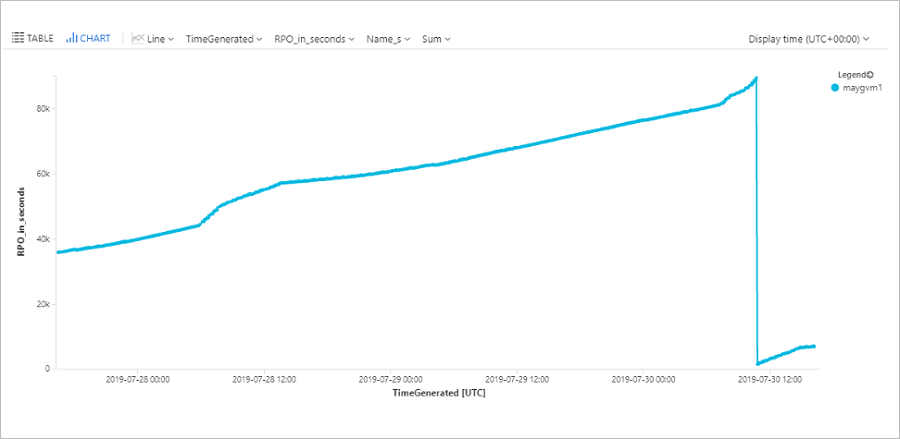
查詢機器 RPO
此查詢會繪製一個趨勢圖,以追蹤過去 72 小時內特定 Azure 虛擬機器 (ContosoVM123) 的 RPO。
AzureDiagnostics
| where replicationProviderName_s == "A2A"
| where TimeGenerated > ago(72h)
| where isnotempty(name_s) and isnotnull(name_s)
| where name_s == "ContosoVM123"
| project TimeGenerated, name_s , RPO_in_seconds = rpoInSeconds_d
| render timechart
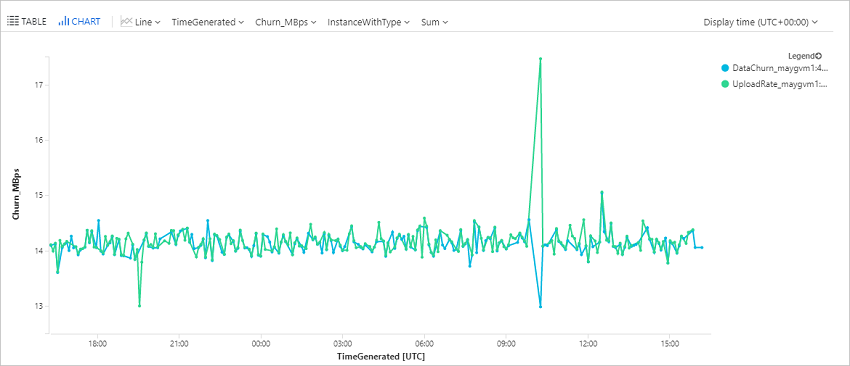
Azure 虛擬機器的查詢資料變更率 (變換) 和上傳率
此查詢會繪製特定 Azure 虛擬機器 (ContosoVM123) 的趨勢圖,表示 (每秒寫入位元組) 和資料上傳速率的資料變更率。
AzureDiagnostics
| where Category in ("AzureSiteRecoveryProtectedDiskDataChurn", "AzureSiteRecoveryReplicationDataUploadRate")
| extend CategoryS = case(Category contains "Churn", "DataChurn",
Category contains "Upload", "UploadRate", "none")
| extend InstanceWithType=strcat(CategoryS, "_", InstanceName_s)
| where TimeGenerated > ago(24h)
| where InstanceName_s startswith "ContosoVM123"
| project TimeGenerated , InstanceWithType , Churn_MBps = todouble(Value_s)/1048576
| render timechart
VMware 或實體機器的查詢資料變更率 (變換) 和上傳率
注意
請確定您已在進程伺服器上設定監視代理程式來提取這些記錄。 請參閱設定監視代理程式的步驟。
此查詢會針對複寫項目 (9r7sfh9qlru) 的特定磁碟 (disk0) 繪製趨勢圖,表示資料變更率 (每秒寫入位元組數) 和資料上傳速率。 您可以在復原服務保存庫中複寫項目的磁碟刀鋒視窗上找到磁碟名稱。 查詢中要使用的執行個體名稱為電腦 DNS 名稱,後面接著 _ 和磁碟名稱,如此範例所示。
Perf
| where ObjectName == "ASRAnalytics"
| where InstanceName contains "win-9r7sfh9qlru_disk0"
| where TimeGenerated >= ago(4h)
| project TimeGenerated ,CounterName, Churn_MBps = todouble(CounterValue)/5242880
| render timechart
處理序伺服器每隔 5 分鐘就會將此資料推送至 Log Analytics 工作區。 這些資料點代表 5 分鐘的平均計算。
查詢災害復原摘要 (Azure 至 Azure)
此查詢會繪製複寫至次要 Azure 區域的 Azure 虛擬機器摘要資料表。 其會顯示虛擬機器識別碼、複寫和保護狀態、RPO、測試容錯移轉狀態、行動代理程式版本、任何作用中的複寫錯誤,以及來源位置。
AzureDiagnostics
| where replicationProviderName_s == "A2A"
| where isnotempty(name_s) and isnotnull(name_s)
| summarize hint.strategy=partitioned arg_max(TimeGenerated, *) by name_s
| project VirtualMachine = name_s , Vault = Resource , ReplicationHealth = replicationHealth_s, Status = protectionState_s, RPO_in_seconds = rpoInSeconds_d, TestFailoverStatus = failoverHealth_s, AgentVersion = agentVersion_s, ReplicationError = replicationHealthErrors_s, SourceLocation = primaryFabricName_s
查詢災害復原摘要 (VMware/實體伺服器)
此查詢會針對複寫至 Azure 的 VMWare 虛擬機器和實體伺服器,繪製摘要資料表。 其會顯示電腦名稱、複寫和保護狀態、RPO、測試容錯移轉狀態、行動代理程式版本、任何作用中的複寫錯誤,以及相關的處理序伺服器。
AzureDiagnostics
| where replicationProviderName_s == "InMageRcm"
| where isnotempty(name_s) and isnotnull(name_s)
| summarize hint.strategy=partitioned arg_max(TimeGenerated, *) by name_s
| project VirtualMachine = name_s , Vault = Resource , ReplicationHealth = replicationHealth_s, Status = protectionState_s, RPO_in_seconds = rpoInSeconds_d, TestFailoverStatus = failoverHealth_s, AgentVersion = agentVersion_s, ReplicationError = replicationHealthErrors_s, ProcessServer = processServerName_g
設定警示 - 範例
您可以根據 Azure 監視器資料來設定 Site Recovery 警示。 深入了解如何設定記錄警示。
注意
部分範例使用 replicationProviderName_s 設定為 A2A。 這會針對複寫至次要 Azure 區域的 Azure 虛擬機器設定警示。 在這些範例中,如果您想要針對複寫至 Azure 的內部部署 VMWare 虛擬機器或實體伺服器設定警示,可以將 A2A 取代為 InMageRcm。
多部電腦處於嚴重狀態
設定當有超過 20 個已複寫的 Azure 虛擬機器進入嚴重狀態時發出警示。
AzureDiagnostics
| where replicationProviderName_s == "A2A"
| where replicationHealth_s == "Critical"
| where isnotempty(name_s) and isnotnull(name_s)
| summarize hint.strategy=partitioned arg_max(TimeGenerated, *) by name_s
| summarize count()
針對警示,將 [閾值] 設定為 20。
處於嚴重狀態的單一電腦
設定當有特定的已複寫 Azure 虛擬機器進入嚴重狀態時發出警示。
AzureDiagnostics
| where replicationProviderName_s == "A2A"
| where replicationHealth_s == "Critical"
| where name_s == "ContosoVM123"
| where isnotempty(name_s) and isnotnull(name_s)
| summarize hint.strategy=partitioned arg_max(TimeGenerated, *) by name_s
| summarize count()
針對警示,將 [閾值] 設定為 1。
多部機器超過 RPO
設定當有超過 20 個 Azure 虛擬機器的 RPO 超過 30 分鐘時發出警示。
AzureDiagnostics
| where replicationProviderName_s == "A2A"
| where isnotempty(name_s) and isnotnull(name_s)
| where rpoInSeconds_d > 1800
| summarize hint.strategy=partitioned arg_max(TimeGenerated, *) by name_s
| project name_s , rpoInSeconds_d
| summarize count()
針對警示,將 [閾值] 設定為 20。
單一電腦超過 RPO
設定當有單一 Azure 虛擬機器的 RPO 超過 30 分鐘時發出警示。
AzureDiagnostics
| where replicationProviderName_s == "A2A"
| where isnotempty(name_s) and isnotnull(name_s)
| where name_s == "ContosoVM123"
| where rpoInSeconds_d > 1800
| summarize hint.strategy=partitioned arg_max(TimeGenerated, *) by name_s
| project name_s , rpoInSeconds_d
| summarize count()
針對警示,將 [閾值] 設定為 1。
多部電腦的測試容錯移轉超過 90 天
設定當上一次成功的測試容錯移轉超過 90 天,且是針對超過 20 部虛擬機器時發出警示。
AzureDiagnostics
| where replicationProviderName_s == "A2A"
| where Category == "AzureSiteRecoveryReplicatedItems"
| where isnotempty(name_s) and isnotnull(name_s)
| where lastSuccessfulTestFailoverTime_t <= ago(90d)
| summarize hint.strategy=partitioned arg_max(TimeGenerated, *) by name_s
| summarize count()
針對警示,將 [閾值] 設定為 20。
單一機器的測試容錯移轉超過 90 天
設定當上一次成功針對特定虛擬機器的成功測試容錯移轉超過 90 天時發出警示。
AzureDiagnostics
| where replicationProviderName_s == "A2A"
| where Category == "AzureSiteRecoveryReplicatedItems"
| where isnotempty(name_s) and isnotnull(name_s)
| where lastSuccessfulTestFailoverTime_t <= ago(90d)
| where name_s == "ContosoVM123"
| summarize hint.strategy=partitioned arg_max(TimeGenerated, *) by name_s
| summarize count()
針對警示,將 [閾值] 設定為 1。
Site Recovery 作業失敗
設定當 Site Recovery 作業 (在此案例中為重新保護作業) 位在過去一天內的任何 Site Recovery 案例中時發出警示。
AzureDiagnostics
| where Category == "AzureSiteRecoveryJobs"
| where OperationName == "Reprotect"
| where ResultType == "Failed"
| summarize count()
針對警示,將 [閾值] 設定為 1,並將 [期間] 設為 [1440 分鐘],以檢查最後一天的失敗次數。
下一步
瞭解內建 Site Recovery 監視。