針對 適用於 PostgreSQL 的 Azure 資料庫 中緩慢執行的查詢進行疑難解答和識別 - 彈性伺服器
適用於:  適用於 PostgreSQL 的 Azure 資料庫 - 彈性伺服器
本文說明如何識別及診斷執行緩慢查詢的根本原因。
在本文中,您可了解:
- 如何識別執行緩慢的查詢。
- 如何識別慢速執行的程式。 識別屬於相同緩慢執行預存程式之查詢清單中的慢速查詢。
必要條件
依照使用疑難解答指南中所述 的步驟啟用疑難解答指南。
設定
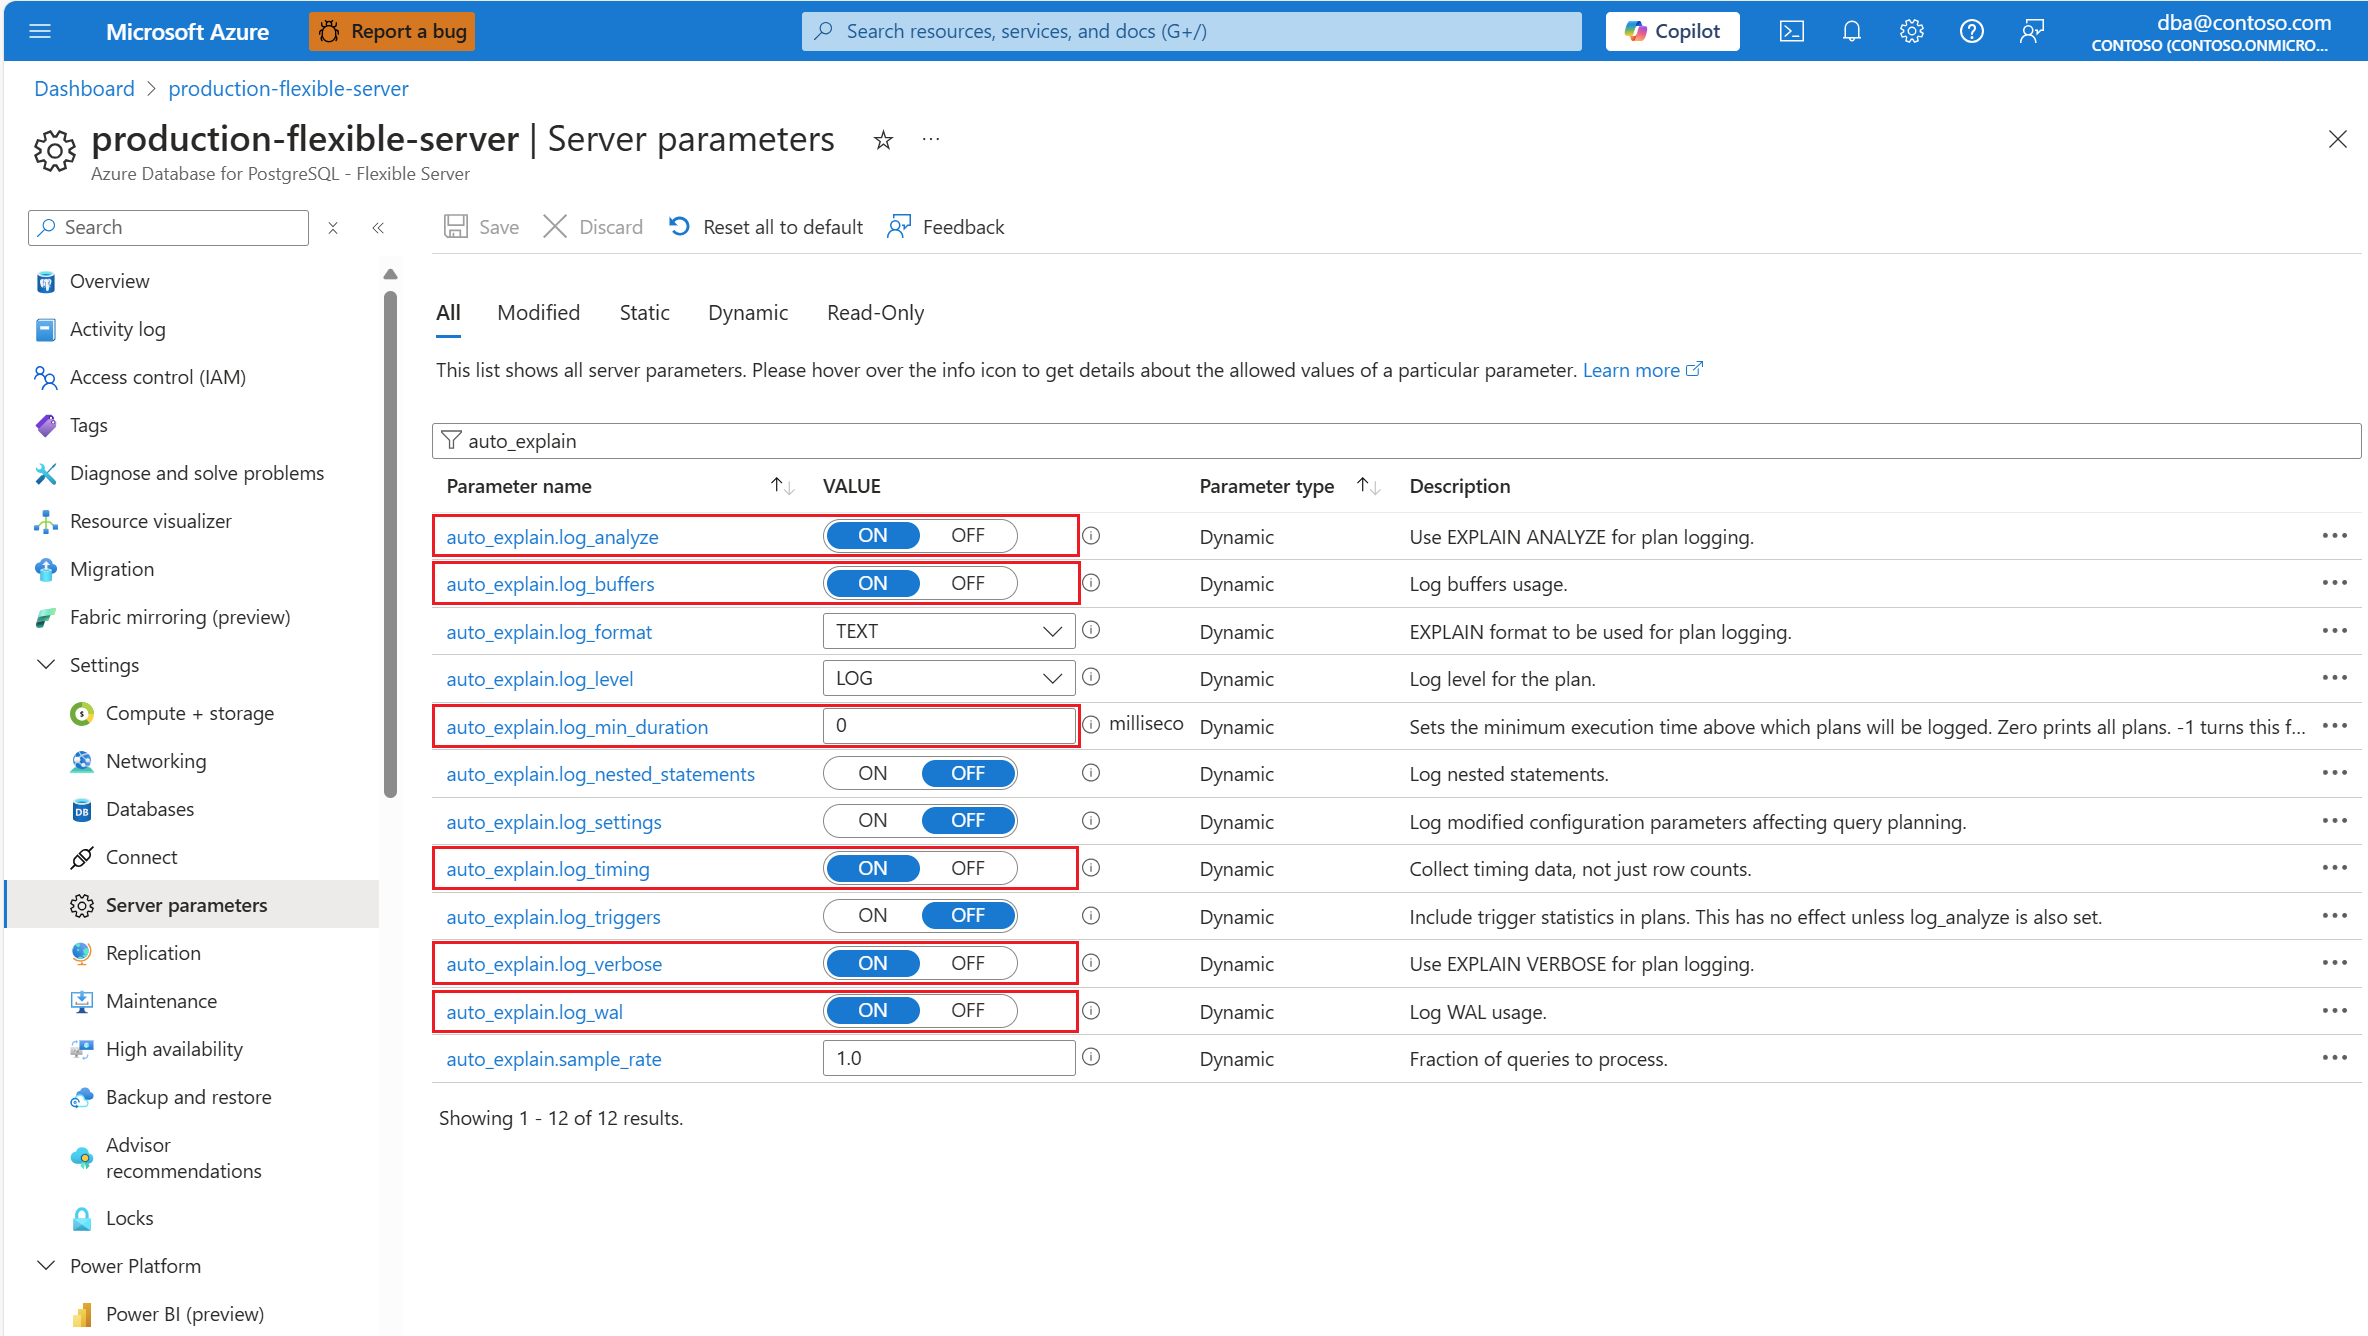
auto_explain擴充功能之後,請變更下列 伺服器參數,以控制擴充功能的行為:auto_explain.log_analyze至ON。auto_explain.log_buffers至ON。auto_explain.log_min_duration根據您案例中的合理性。auto_explain.log_timing至ON。auto_explain.log_verbose至ON。
注意
如果您設定 auto_explain.log_min_duration 為 0,擴充功能會開始記錄伺服器上執行的所有查詢。 這可能會影響資料庫的效能。 必須進行適當的盡職盡責,才能得出伺服器上被視為緩慢的值。 例如,如果所有查詢在不到 30 秒內完成,而且您的應用程式可以接受,則建議將 參數更新為 30000 毫秒。 然後,這會記錄任何需要超過 30 秒才能完成的查詢。
識別慢速查詢
使用疑難解答指南和 auto_explain 擴充功能,我們會透過範例的協助來描述案例。
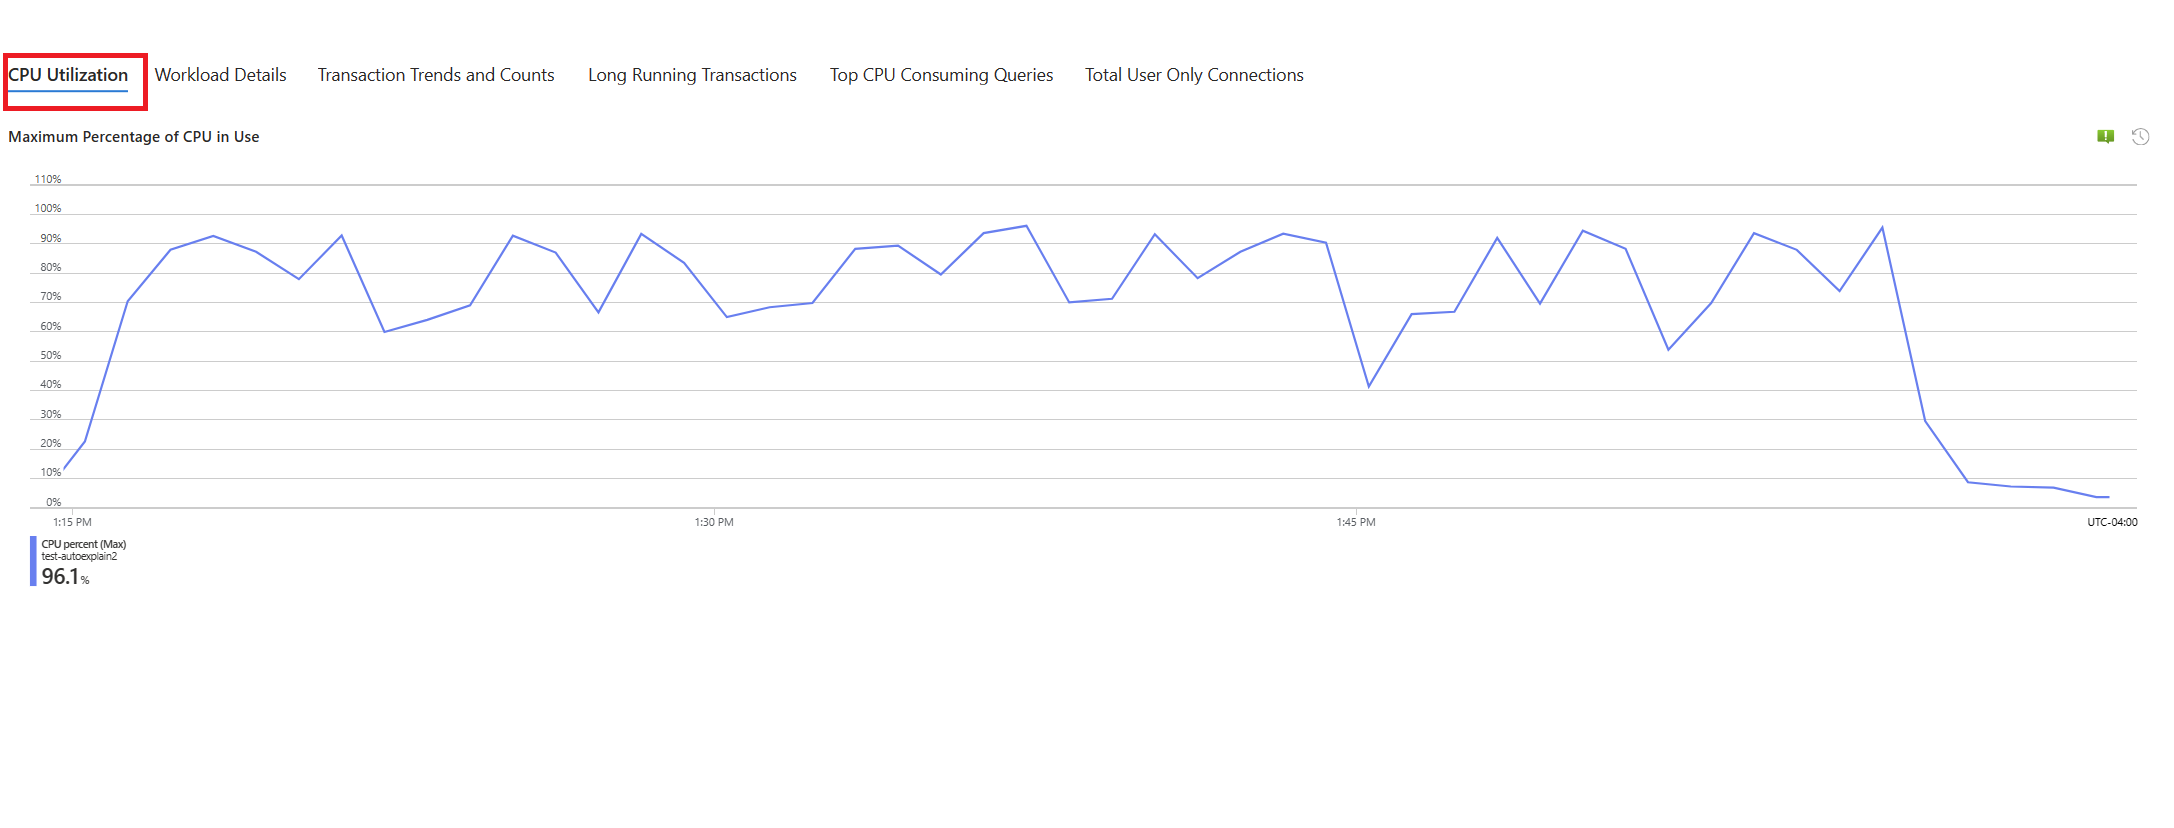
我們有一個案例,其中CPU使用率尖峰達到90%,並想要判斷尖峰的原因。 若要偵錯案例,請遵循下列步驟:
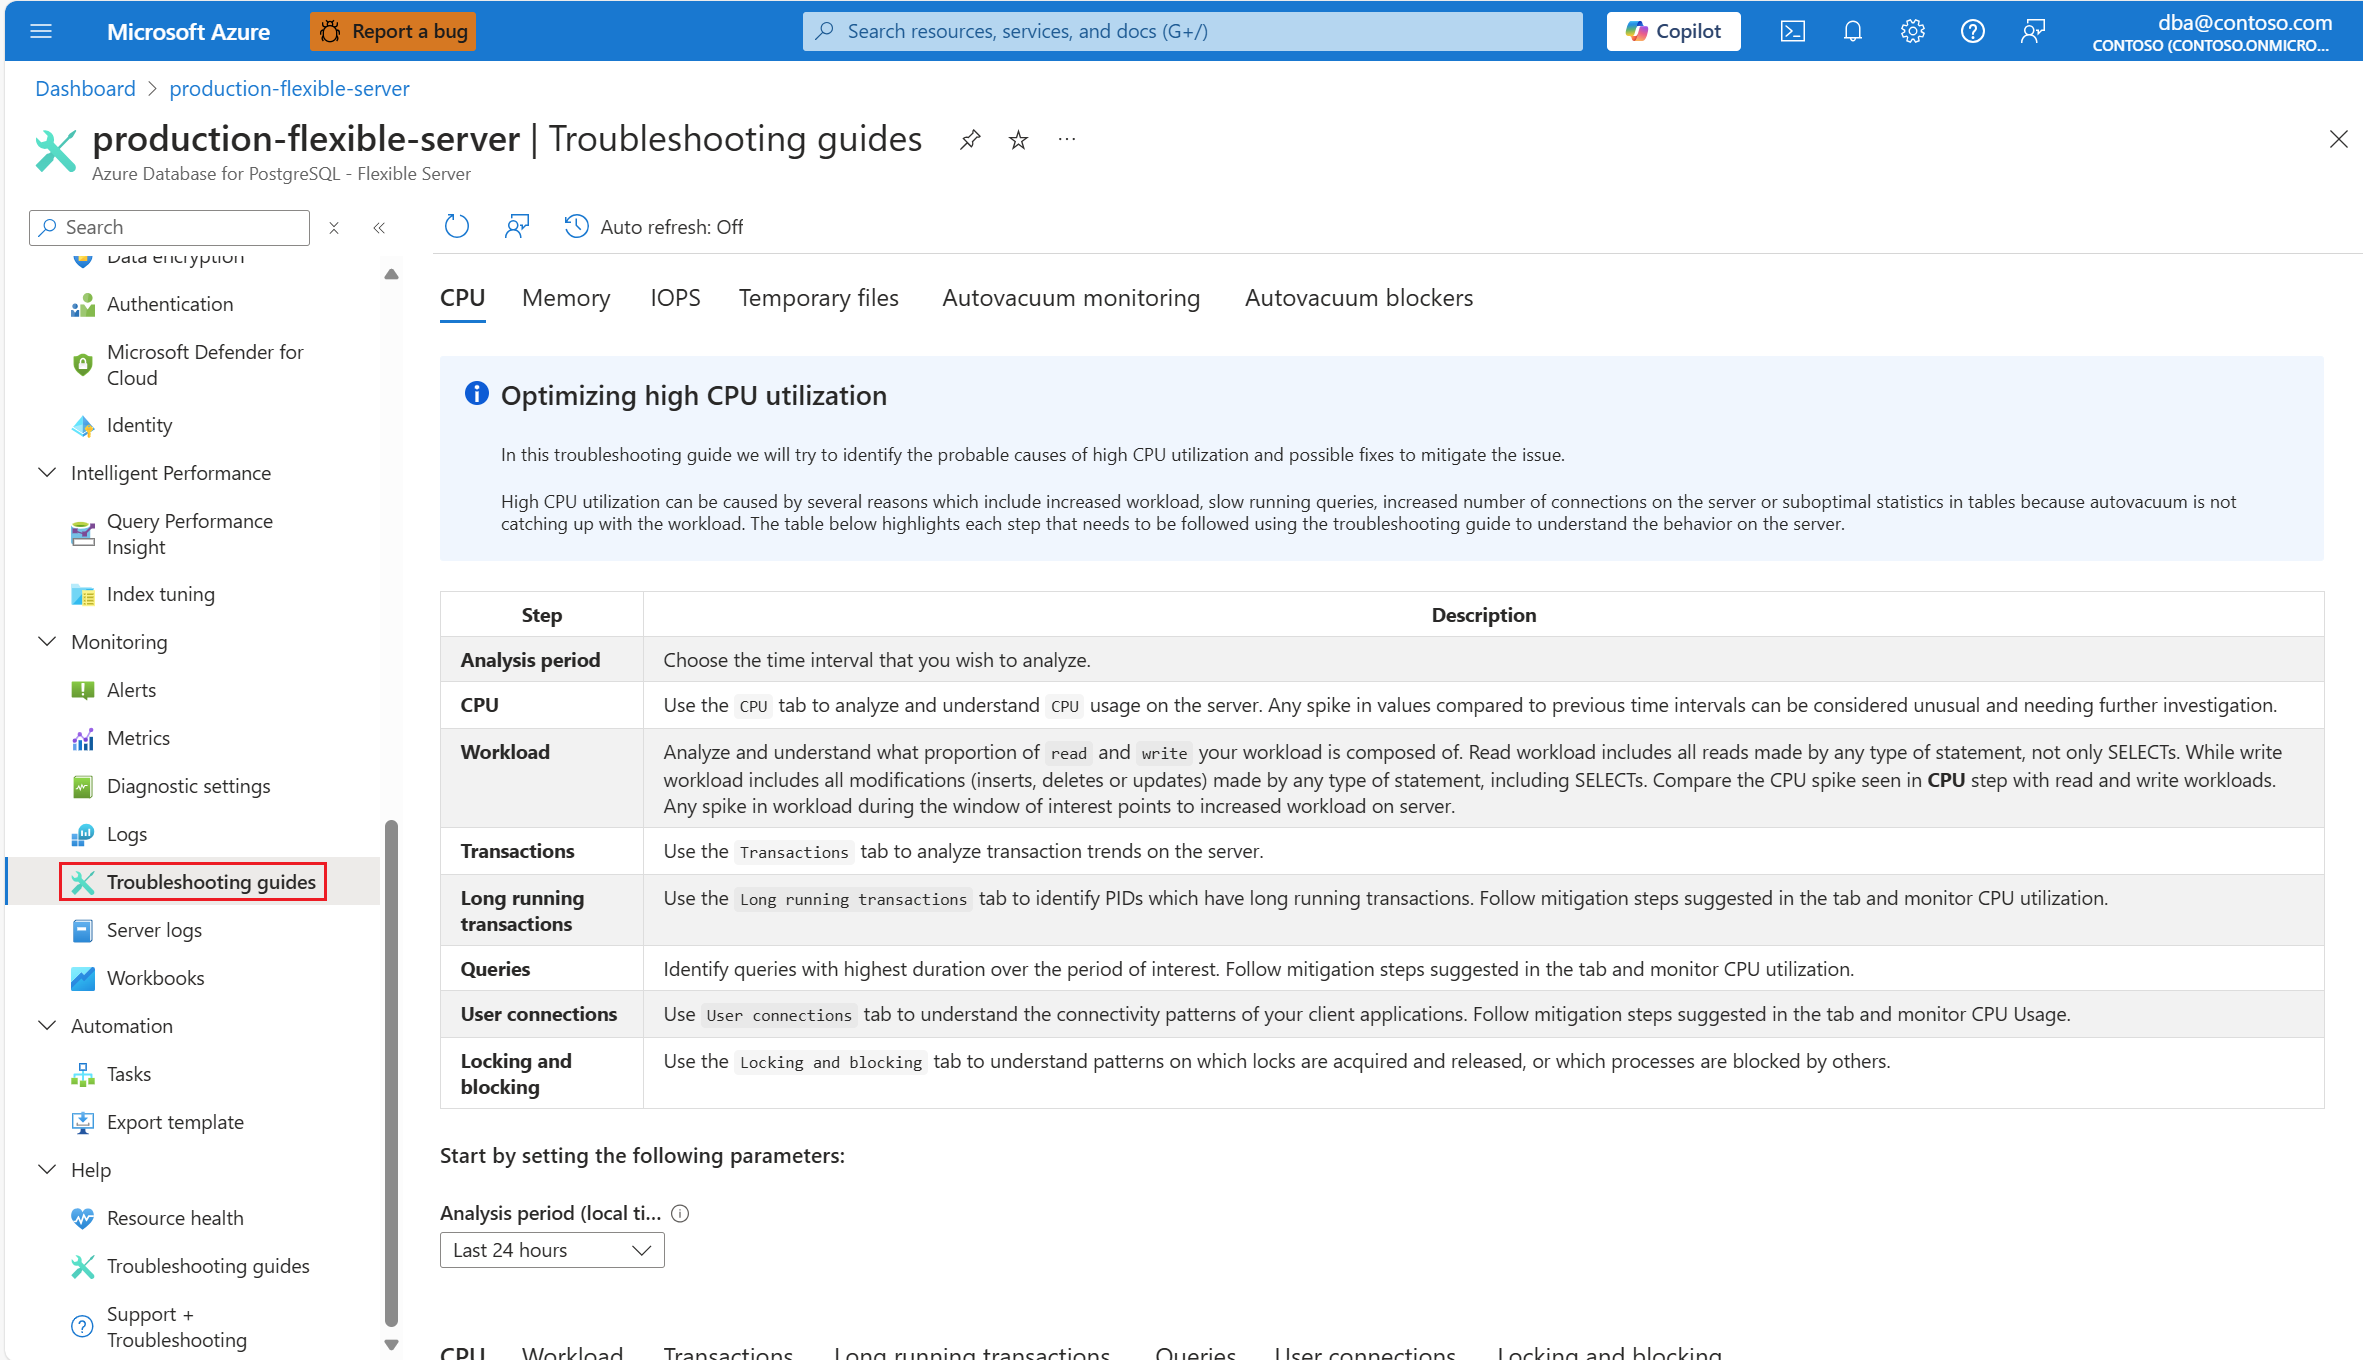
一旦您收到 CPU 案例的警示,請在 [監視] 區段下的 [適用於 PostgreSQL 的 Azure 資料庫 彈性伺服器] 受影響實例的資源功能表中,選取 [疑難解答指南]。
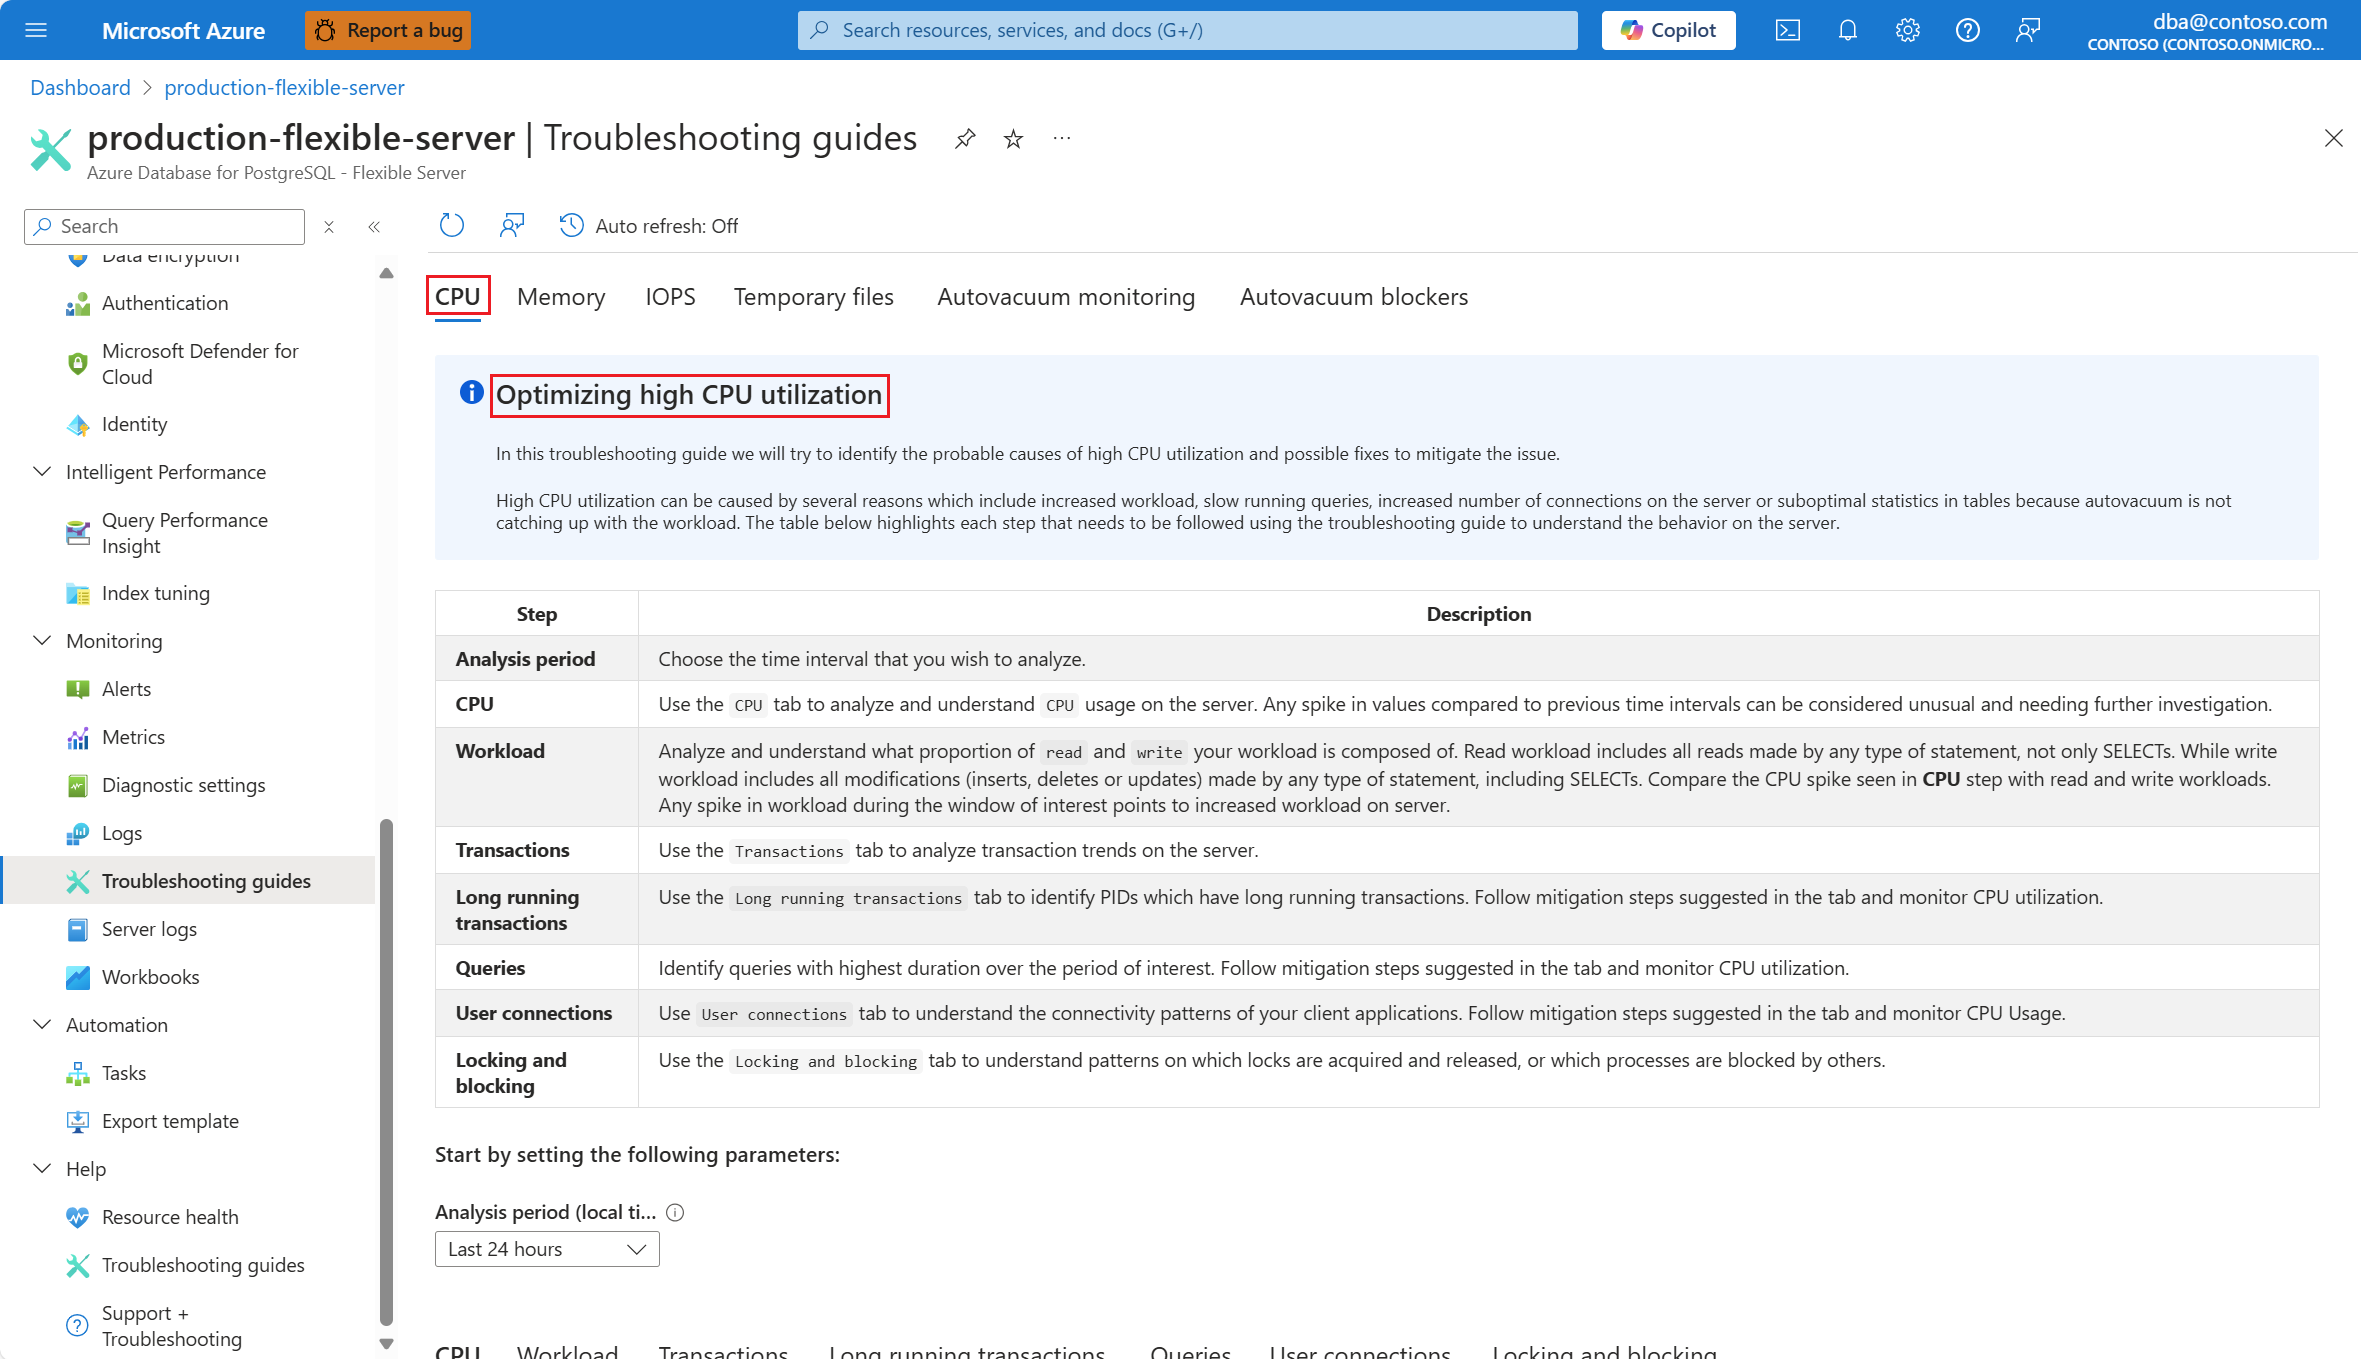
選取 [CPU] 索引標籤。隨即開啟優化高 CPU 使用率疑難解答指南。
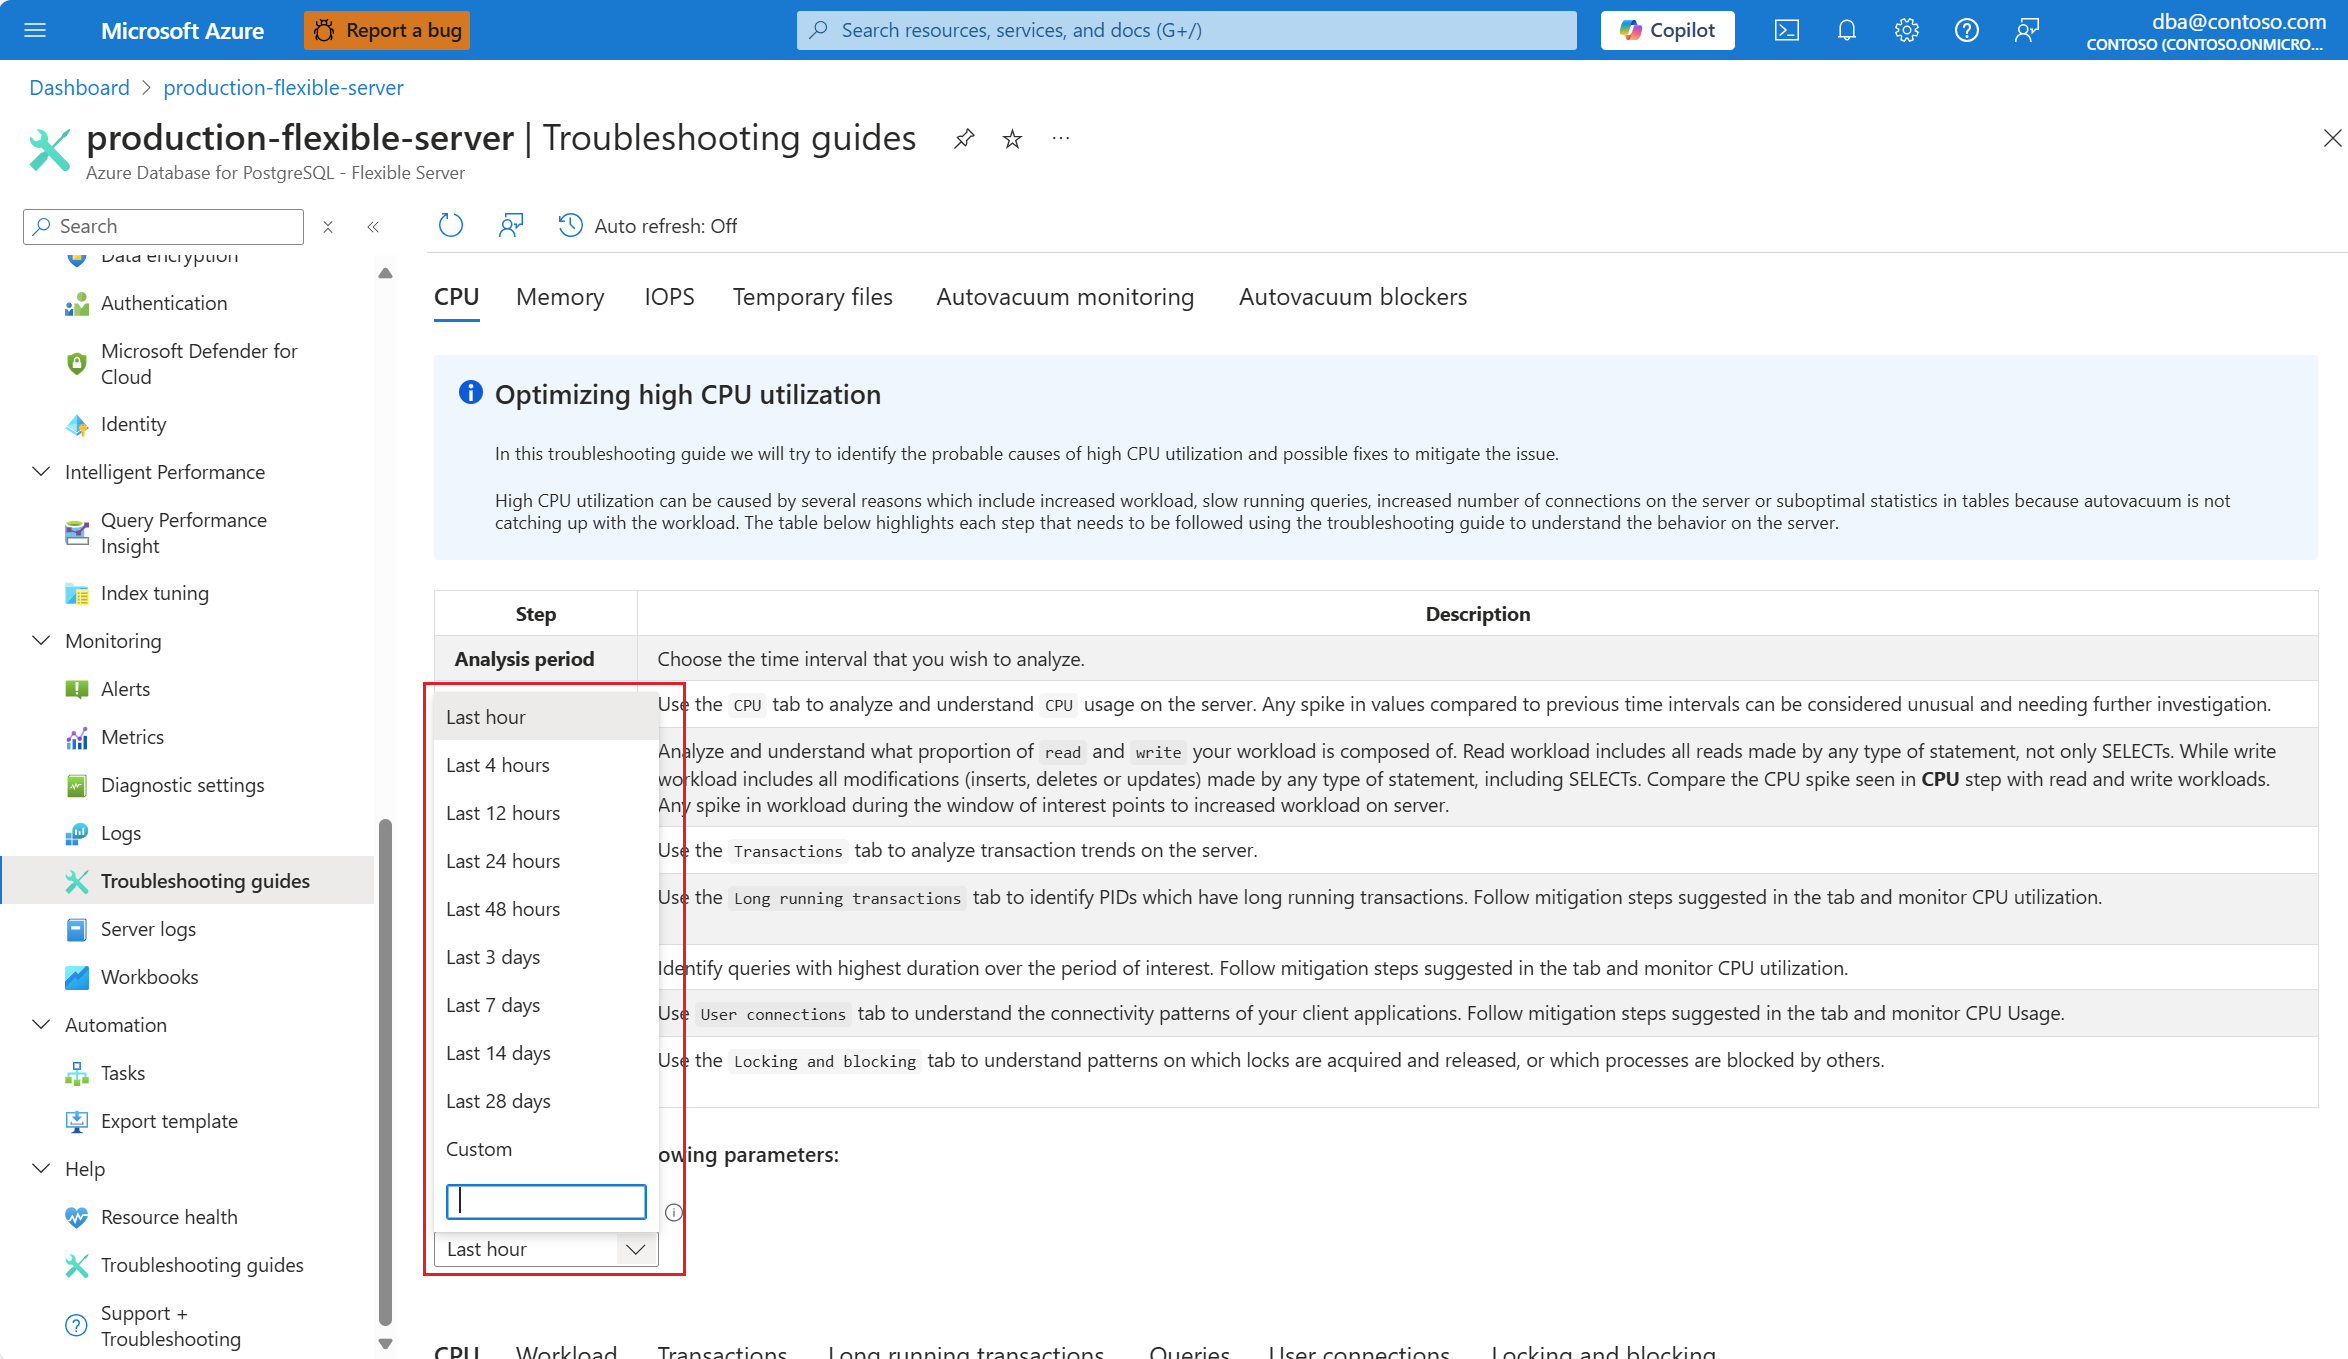
從 [ 分析期間(當地時間)] 下拉式清單中,選取您想要將分析焦點的時間範圍。
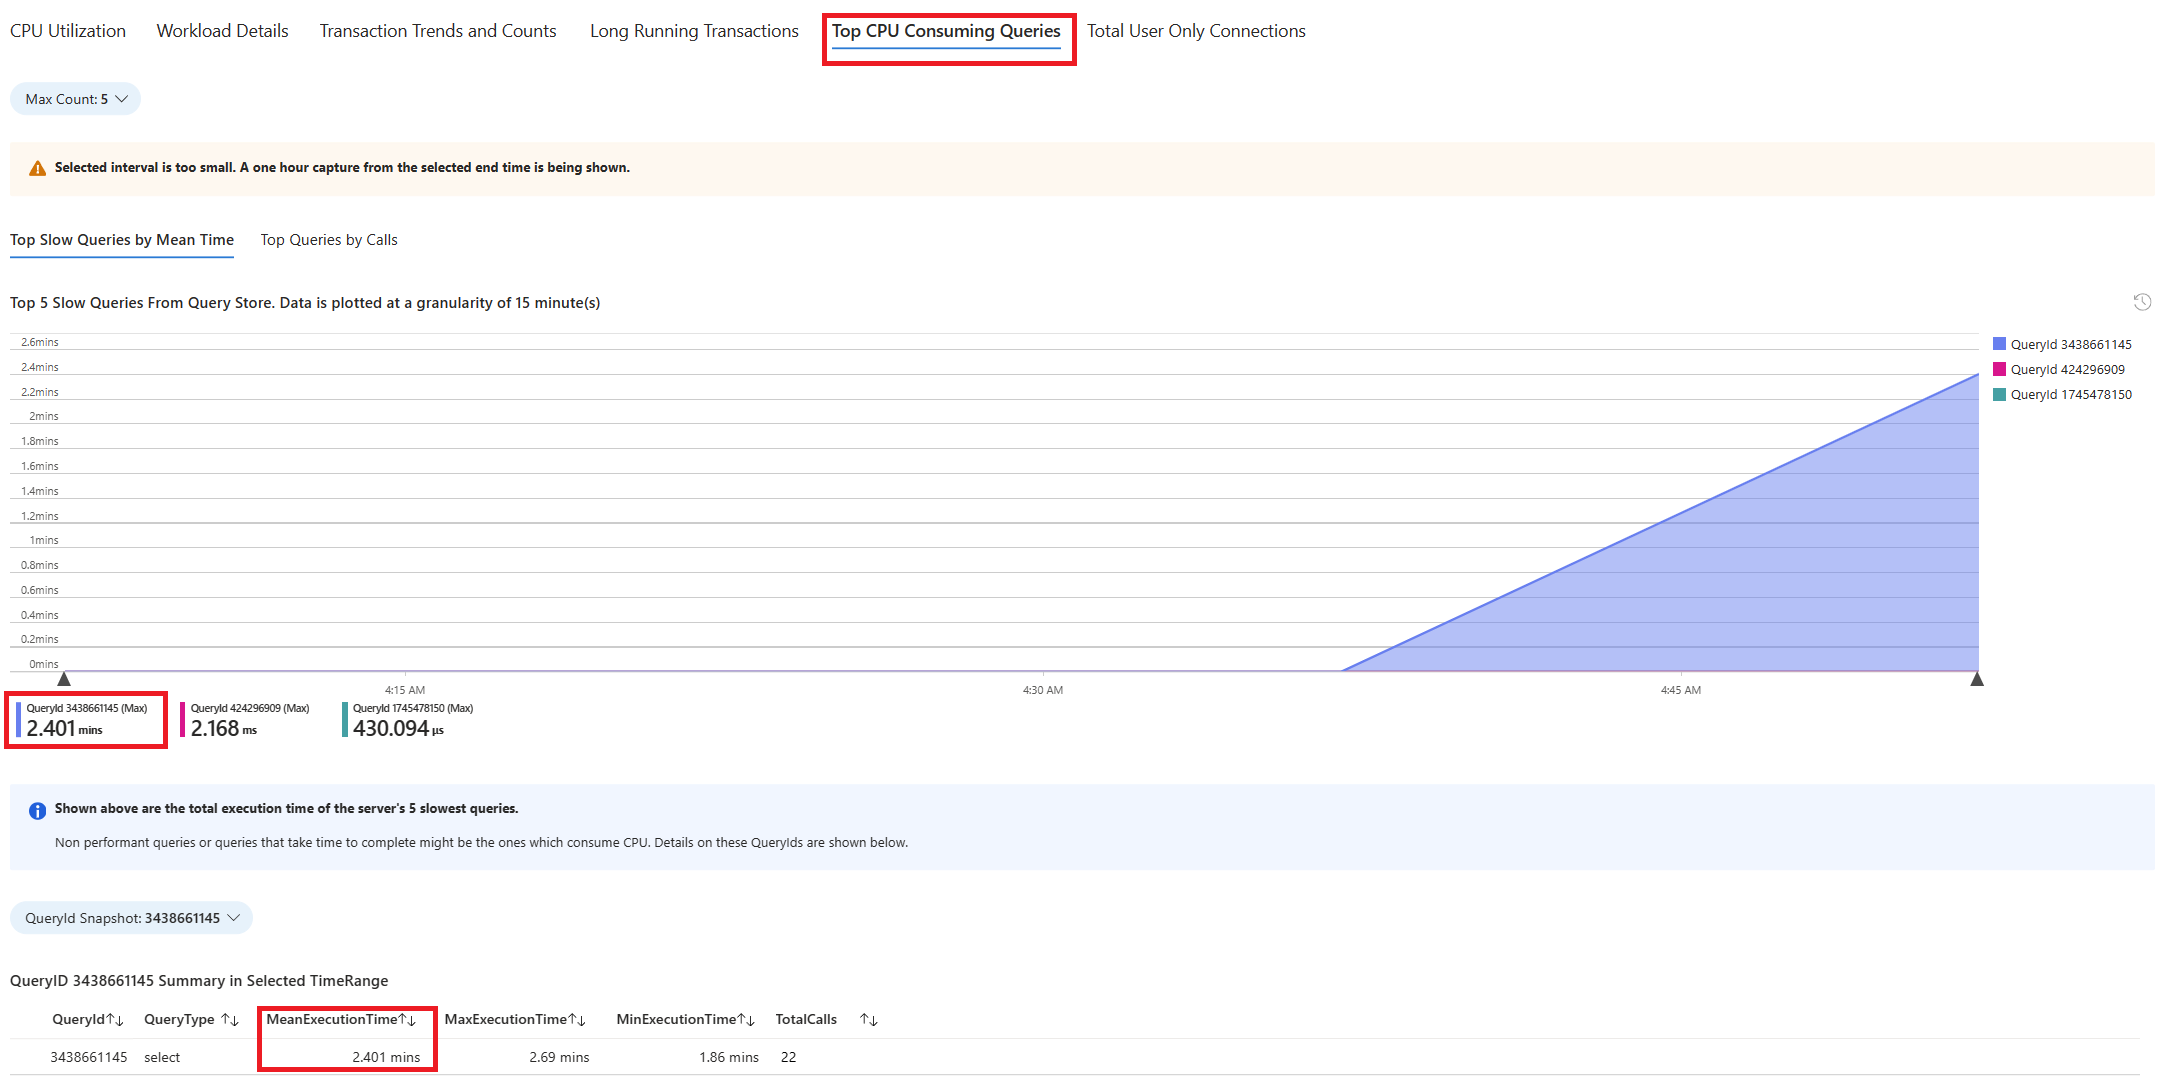
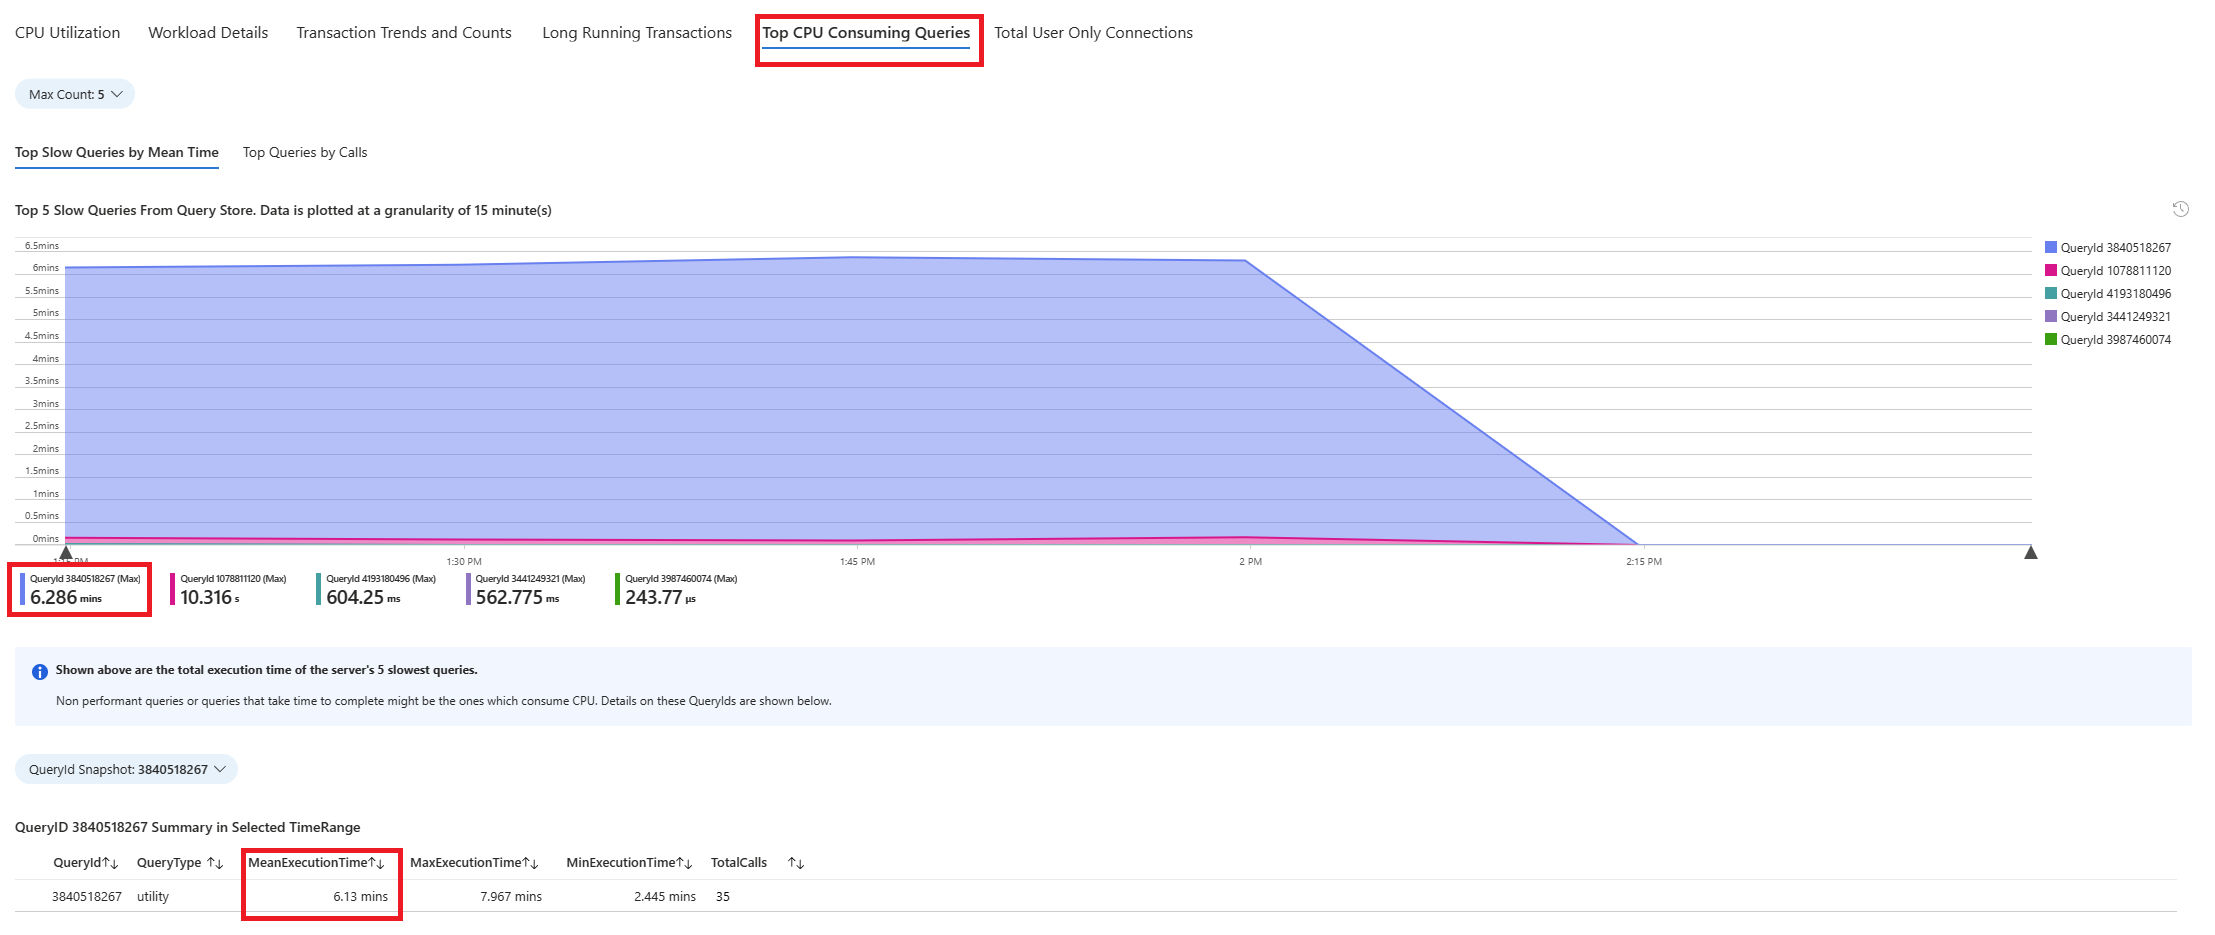
選取 [ 查詢] 索引標籤。它會顯示在看到 90% CPU 使用率的間隔內執行的所有查詢詳細數據。 從快照集來看,查詢看起來像是時間間隔期間平均運行時間最慢的查詢是 ~2.6 分鐘,而查詢在間隔期間執行了 22 次。 該查詢很可能是CPU尖峰的原因。
若要擷取實際的查詢文字,請連線到
azure_sys資料庫並執行下列查詢。
    psql -h <server>.postgres.database.azure.com -U <user> -d azure_sys

     SELECT query_sql_text
     FROM query_store.query_texts_view
     WHERE query_text_id = <query_id>;
- 在已考慮的範例中,發現速度緩慢的查詢為:
SELECT  c_id, SUM(c_balance) AS total_balance
FROM customer
GROUP BY c_w_id, c_id
ORDER BY c_w_id;
若要了解產生的確切說明計劃,請使用 適用於 PostgreSQL 的 Azure 資料庫 彈性伺服器記錄。 每次查詢在該時間範圍期間完成執行時,
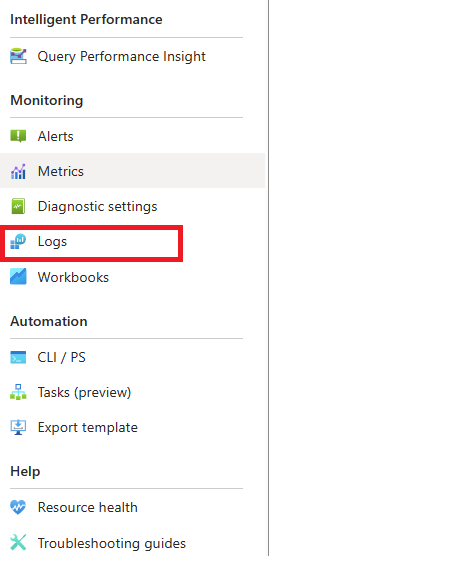
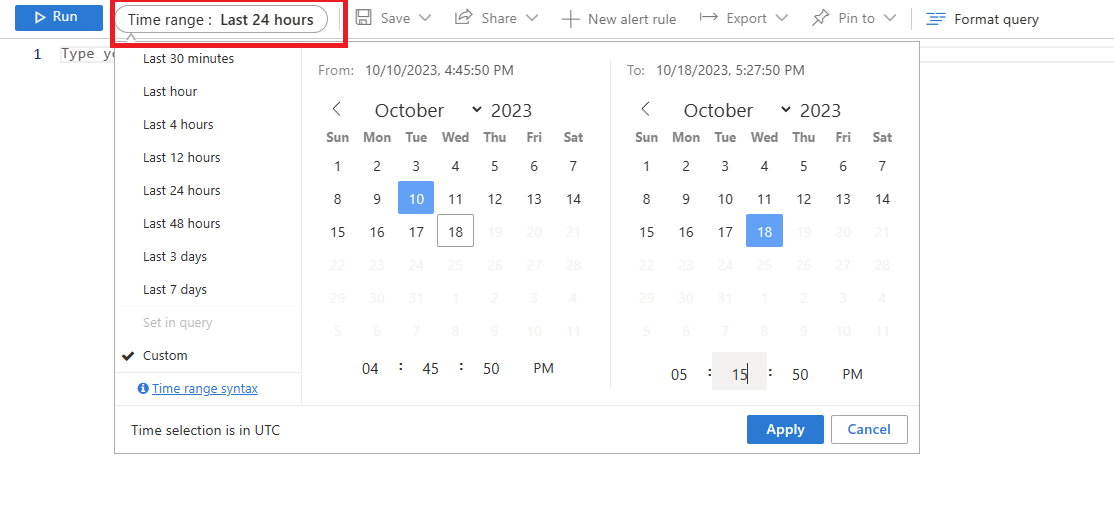
auto_explain擴充功能都應該在記錄中寫入專案。 在資源功能表中的 [監視] 區段底下,選取 [記錄]。選取找到 90% CPU 使用率的時間範圍。
執行下列查詢,以擷取所識別查詢的EXPLAIN ANALYZE 輸出。
AzureDiagnostics
| where Category contains  'PostgreSQLLogs'
| where Message contains "<snippet of SQL text identified or name of any of the tables referenced in the query>"
| project TimeGenerated, Message
訊息資料行會儲存執行計劃,如下列輸出所示:
2024-11-10 19:56:46 UTC-6525a8e7.2e3d-LOG: duration: 150692.864 ms plan:

Query Text: SELECT c_id, SUM(c_balance) AS total_balance
FROM customer
GROUP BY c_w_id,c_id
order by c_w_id;
GroupAggregate (cost=1906820.83..2131820.83 rows=10000000 width=40) (actual time=70930.833..129231.950 rows=10000000 loops=1)
Output: c_id, sum(c_balance), c_w_id
Group Key: customer.c_w_id, customer.c_id
Buffers: shared hit=44639 read=355362, temp read=77521 written=77701
-> Sort (cost=1906820.83..1931820.83 rows=10000000 width=13) (actual time=70930.821..81898.430 rows=10000000 loops=1)
Output: c_id, c_w_id, c_balance
Sort Key: customer.c_w_id, customer.c_id
Sort Method: external merge Disk: 225104kB
Buffers: shared hit=44639 read=355362, temp read=77521 written=77701
-> Seq Scan on public.customer (cost=0.00..500001.00 rows=10000000 width=13) (actual time=0.021..22997.697 rows=10000000 loops=1)
Output: c_id, c_w_id, c_balance
查詢執行了約 2.5 分鐘,如疑難解答指南所示。 從 duration 擷取的執行計劃輸出中擷取的 150692.864 毫秒值會確認它。 使用 EXPLAIN ANALYZE 的輸出來進一步進行疑難解答,並微調查詢。
注意
觀察者查詢在間隔期間執行 22 次,且顯示的記錄包含間隔期間所擷取的其中一個專案。
識別預存程式中執行緩慢的查詢
使用疑難解答指南和auto_explain擴充功能,我們會透過範例的協助來說明案例。
我們有一個案例,其中CPU使用率尖峰達到90%,並想要判斷尖峰的原因。 若要偵錯案例,請遵循下列步驟:
一旦您收到 CPU 案例的警示,請在 [監視] 區段下的 [適用於 PostgreSQL 的 Azure 資料庫 彈性伺服器] 受影響實例的資源功能表中,選取 [疑難解答指南]。
選取 [CPU] 索引標籤。隨即開啟優化高 CPU 使用率疑難解答指南。
從 [ 分析期間(當地時間)] 下拉式清單中,選取您想要將分析焦點的時間範圍。
選取 [ 查詢] 索引標籤。它會顯示在看到 90% CPU 使用率的間隔內執行的所有查詢詳細數據。 從快照集來看,查詢看起來像是時間間隔期間平均運行時間最慢的查詢是 ~2.6 分鐘,而查詢在間隔期間執行了 22 次。 該查詢很可能是CPU尖峰的原因。
連接到azure_sys資料庫,並使用下列腳本執行查詢以擷取實際的查詢文字。
    psql -h <server>.postgres.database.azure.com -U <user> -d azure_sys

     SELECT query_sql_text
     FROM query_store.query_texts_view
     WHERE query_text_id = <query_id>;
- 在已考慮的範例中,發現速度緩慢的查詢是預存程式:
call autoexplain_test ();
- 若要了解產生的確切說明計劃,請使用 適用於 PostgreSQL 的 Azure 資料庫 彈性伺服器記錄。 每次查詢在該時間範圍期間完成執行時,
auto_explain擴充功能都應該在記錄中寫入專案。 在資源功能表中的 [監視] 區段底下,選取 [記錄]。 然後,在 [時間範圍:] 中,選取您想要將分析焦點的時間範圍。
- 執行下列查詢,以擷取所識別查詢的分析輸出。
AzureDiagnostics
| where Category contains  'PostgreSQLLogs'
| where Message contains "<snippet of SQL text identified or name of any of the tables referenced in the query>"
| project TimeGenerated, Message
此程式有多個查詢,其醒目提示如下。 此說明會記錄預存程式中所用每個查詢的分析輸出,以進一步分析並進行疑難解答。 所記錄查詢的運行時間可用來識別預存程式一部分最慢的查詢。
2024-11-10 17:52:45 UTC-6526d7f0.7f67-LOG: duration: 38459.176 ms plan:

Query Text: insert into customer_balance SELECT c_id, SUM(c_balance) AS total_balance FROM customer GROUP BY c_w_id,c_id order by c_w_id
Insert on public.customer_balance (cost=1906820.83..2231820.83 rows=0 width=0) (actual time=38459.173..38459.174 rows=0 loops=1)Buffers: shared hit=10108203 read=454055 dirtied=54058, temp read=77521 written=77701 WAL: records=10000000 fpi=1 bytes=640002197
    -> Subquery Scan on "*SELECT*" (cost=1906820.83..2231820.83 rows=10000000 width=36) (actual time=20415.738..29514.742 rows=10000000 loops=1)
        Output: "*SELECT*".c_id, "*SELECT*".total_balance Buffers: shared hit=1 read=400000, temp read=77521 written=77701
            -> GroupAggregate (cost=1906820.83..2131820.83 rows=10000000 width=40) (actual time=20415.737..28574.266 rows=10000000 loops=1)
                Output: customer.c_id, sum(customer.c_balance), customer.c_w_id Group Key: customer.c_w_id, customer.c_id Buffers: shared hit=1 read=400000, temp read=77521 written=77701
                -> Sort (cost=1906820.83..1931820.83 rows=10000000 width=13) (actual time=20415.723..22023.515 rows=10000000 loops=1)
                    Output: customer.c_id, customer.c_w_id, customer.c_balance Sort Key: customer.c_w_id, customer.c_id Sort Method: external merge Disk: 225104kB Buffers: shared hit=1 read=400000, temp read=77521 written=77701
                     -> Seq Scan on public.customer (cost=0.00..500001.00 rows=10000000 width=13) (actual time=0.310..15061.471 rows=10000000 loops=1) Output: customer.c_id, customer.c_w_id, customer.c_balance Buffers: shared hit=1 read=400000

2024-11-10 17:52:07 UTC-6526d7f0.7f67-LOG: duration: 61939.529 ms plan:
Query Text: delete from customer_balance
Delete on public.customer_balance (cost=0.00..799173.51 rows=0 width=0) (actual time=61939.525..61939.526 rows=0 loops=1) Buffers: shared hit=50027707 read=620942 dirtied=295462 written=71785 WAL: records=50026565 fpi=34 bytes=2711252160
    -> Seq Scan on public.customer_balance (cost=0.00..799173.51 rows=15052451 width=6) (actual time=3185.519..35234.061 rows=50000000 loops=1)
        Output: ctid Buffers: shared hit=27707 read=620942 dirtied=26565 written=71785 WAL: records=26565 fpi=34 bytes=11252160


2024-11-10 17:51:05 UTC-6526d7f0.7f67-LOG: duration: 10387.322 ms plan:
Query Text: select max(c_id) from customer
Finalize Aggregate (cost=180185.84..180185.85 rows=1 width=4) (actual time=10387.220..10387.319 rows=1 loops=1) Output: max(c_id) Buffers: shared hit=37148 read=1204 written=69
    -> Gather (cost=180185.63..180185.84 rows=2 width=4) (actual time=10387.214..10387.314 rows=1 loops=1)
        Output: (PARTIAL max(c_id)) Workers Planned: 2 Workers Launched: 0 Buffers: shared hit=37148 read=1204 written=69
        -> Partial Aggregate (cost=179185.63..179185.64 rows=1 width=4) (actual time=10387.012..10387.013 rows=1 loops=1) Output: PARTIAL max(c_id) Buffers: shared hit=37148 read=1204 written=69
            -> Parallel Index Only Scan using customer_i1 on public.customer (cost=0.43..168768.96 rows=4166667 width=4) (actual time=0.446..7676.356 rows=10000000 loops=1)
               Output: c_w_id, c_d_id, c_id Heap Fetches: 24 Buffers: shared hit=37148 read=1204 written=69
注意
為了示範目的,只會顯示程式中一些查詢的 EXPLAIN ANALYZE 輸出。 其概念是可以收集記錄中所有查詢的 EXPLAIN ANALYZE 輸出,並找出其中最慢的查詢,並嘗試微調這些查詢。
