Kusto 查詢語言 (KQL) 圖表語意的最佳做法
本文說明如何在 KQL 中有效且有效率地針對不同的使用案例和案例使用圖表語意功能。 它示範如何使用語法和運算符來建立和查詢圖表,以及如何將其與其他 KQL 功能和函式整合。 它也可協助使用者避免常見的陷阱或錯誤,例如建立超過記憶體或效能限制的圖形,或套用不適合或不相容的篩選、投影或匯總。
圖形大小
make-graph 運算符會建立圖形的記憶體內部表示法。 它是由圖形結構本身及其屬性所組成。 製作圖形時,請使用適當的篩選、投影和匯總,只選取相關的節點和邊緣及其屬性。
下列範例示範如何減少節點和邊緣的數目及其屬性。 在此案例中,Bob 會將管理員從 Alice 變更為 Eve,而使用者只想要查看其組織圖表的最新狀態。 為了減少圖形的大小,節點會先由組織屬性篩選,然後使用 project-away 運算符從圖形中移除 屬性。 邊緣也是如此。 然後 summarize 運算子 與 arg_max 一起用來取得圖形的最後一個已知狀態。
let allEmployees = datatable(organization: string, name:string, age:long)
[
  "R&D", "Alice", 32,
  "R&D","Bob", 31,
  "R&D","Eve", 27,
  "R&D","Mallory", 29,
  "Marketing", "Alex", 35
];
let allReports = datatable(employee:string, manager:string, modificationDate: datetime)
[
  "Bob", "Alice", datetime(2022-05-23),
  "Bob", "Eve", datetime(2023-01-01),
  "Eve", "Mallory", datetime(2022-05-23),
  "Alice", "Dave", datetime(2022-05-23)
];
let filteredEmployees =
    allEmployees
    | where organization == "R&D"
    | project-away age, organization;
let filteredReports =
    allReports
    | summarize arg_max(modificationDate, *) by employee
    | project-away modificationDate;
filteredReports
| make-graph employee --> manager with filteredEmployees on name
| graph-match (employee)-[hasManager*2..5]-(manager)
  where employee.name == "Bob"
  project employee = employee.name, topManager = manager.name
輸出
| 員工 | topManager |
|---|---|
| Bob | 馬婁裡 |
圖形的最後已知狀態
圖形的大小範例示範如何使用 運算子和arg_max聚合函數,取得圖形summarize邊緣的最後已知狀態。 取得最後一個已知狀態是計算密集型作業。
請考慮建立具體化檢視來改善查詢效能,如下所示:
建立具有一些版本概念的數據表,做為其模型的一部分。 建議您使用
datetime稍後可用來建立圖形時間序列的數據行。.create table employees (organization: string, name:string, stateOfEmployment:string, properties:dynamic, modificationDate:datetime) .create table reportsTo (employee:string, manager:string, modificationDate: datetime)為每個數據表建立具體化檢視,並使用arg_max聚合函數來判斷員工和 reportsTo relation 的最後已知狀態。
.create materialized-view employees_MV on table employees
{
    employees
    | summarize arg_max(modificationDate, *) by name
}

.create materialized-view reportsTo_MV on table reportsTo
{
    reportsTo
    | summarize arg_max(modificationDate, *) by employee
}
建立兩個函式,以確保只使用具體化檢視的具體化元件,並套用其他篩選和投影。
.create function currentEmployees () {
    materialized_view('employees_MV')
    | where stateOfEmployment == "employed"
}

.create function reportsTo_lastKnownState () {
    materialized_view('reportsTo_MV')
    | project-away modificationDate
}
使用具體化的結果查詢可讓查詢更快速且更有效率地用於較大的圖形。 它也會針對圖形的最新狀態啟用較高的並行存取和較低的延遲查詢。 如有需要,使用者仍然可以根據員工和 reportsTo 數據表來查詢圖表歷程記錄
let filteredEmployees =
    currentEmployees
    | where organization == "R&D"
    | project-away organization;
reportsTo_lastKnownState
| make-graph employee --> manager with filteredEmployees on name
| graph-match (employee)-[hasManager*2..5]-(manager)
  where employee.name == "Bob"
  project employee = employee.name, reportingPath = hasManager.manager
圖形時間移動
某些案例會要求您根據特定時間點的圖表狀態來分析數據。 圖形時間移動會使用時間篩選的組合,並使用arg_max聚合函數摘要。
下列 KQL 語句會使用參數建立函式,以定義圖形的有趣時間點。 它會傳回現成的圖形。
.create function graph_time_travel (interestingPointInTime:datetime ) {
    let filteredEmployees =
        employees
        | where modificationDate < interestingPointInTime
        | summarize arg_max(modificationDate, *) by name;
    let filteredReports =
        reportsTo
        | where modificationDate < interestingPointInTime
        | summarize arg_max(modificationDate, *) by employee
        | project-away modificationDate;
    filteredReports
    | make-graph employee --> manager with filteredEmployees on name
}
有了 函式,使用者就可以根據 2022 年 6 月的圖表製作查詢,以取得 Bob 的最上層管理員。
graph_time_travel(datetime(2022-06-01))
| graph-match (employee)-[hasManager*2..5]-(manager)
  where employee.name == "Bob"
  project employee = employee.name, reportingPath = hasManager.manager
輸出
| 員工 | topManager |
|---|---|
| Bob | Dave |
處理多個節點和邊緣類型
有時候需要將時間序列數據與包含多個節點類型的圖表內容化。 處理此案例的其中一種方式是建立一般用途的屬性圖形,該圖形是由標準模型表示。
有時候,您可能需要使用具有多個節點類型的圖表,將時間序列數據內容化。 您可以藉由建立以標準模型為基礎的一般用途屬性圖形來解決問題,如下所示。
- 節點
- nodeId (string)
- 標籤 (字串)
- properties (dynamic)
- 邊緣
- source (string)
- destination (string)
- 標籤 (字串)
- properties (dynamic)
下列範例示範如何將數據轉換成標準模型,以及如何查詢數據。 圖形節點和邊緣的基表有不同的架構。
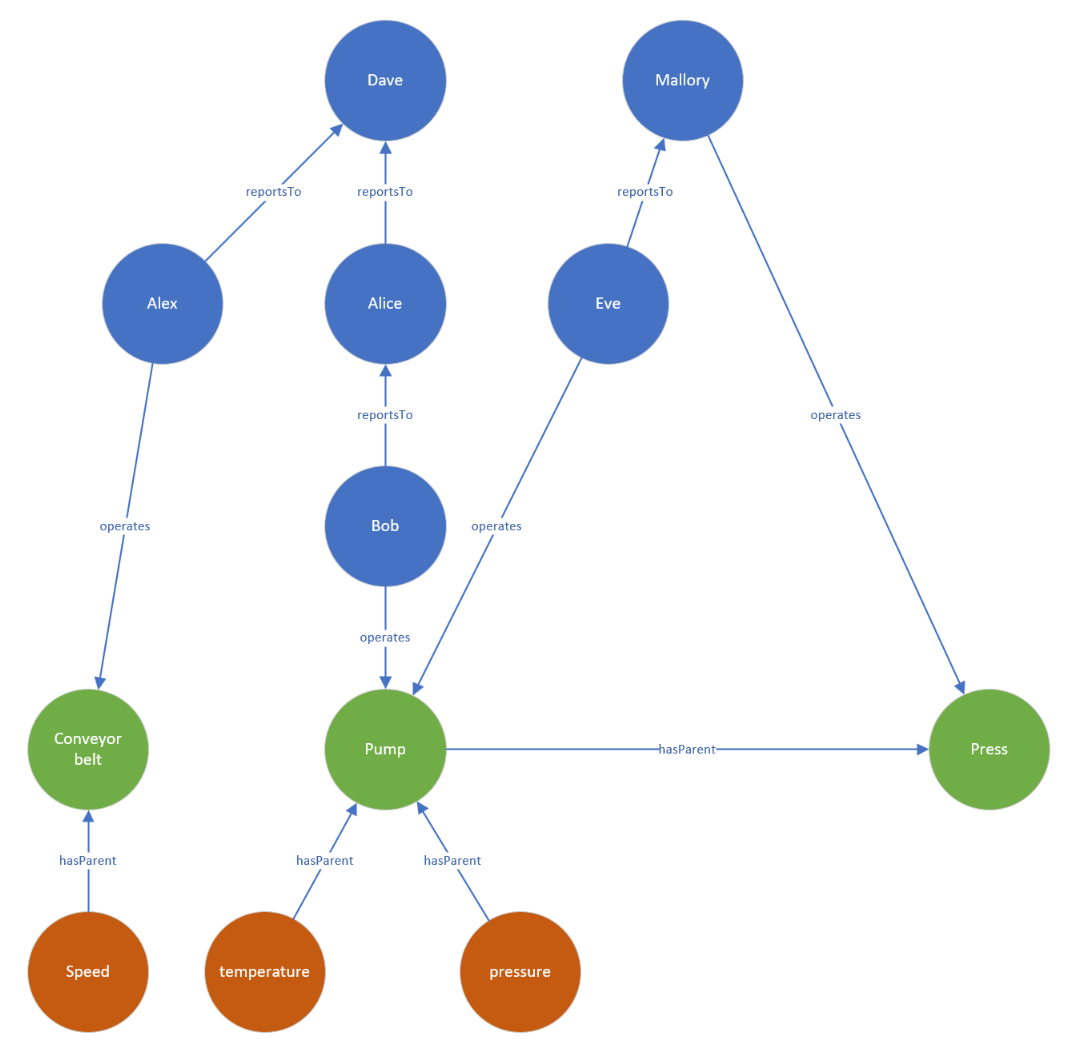
此案例牽涉到想要找出設備無法正常運作的原因,以及負責修復設備的工廠經理。 經理決定使用圖表,結合生產樓層的資產圖表,以及每天變更的維護人員階層。
下圖顯示資產與其時間序列之間的關係,例如速度、溫度和壓力。 運算子和資產,例如 泵,會透過 操作 邊緣連接。 操作員本身會向管理報告。
這些實體的數據可以直接儲存在叢集中,或使用查詢同盟取得至不同的服務,例如 Azure Cosmos DB、Azure SQL 或 Azure Digital Twin。 為了說明範例,下清單格式數據會建立為查詢的一部分:
let sensors = datatable(sensorId:string, tagName:string, unitOfMeasuree:string)
[
  "1", "temperature", "°C",
  "2", "pressure", "Pa",
  "3", "speed", "m/s"
];
let timeseriesData = datatable(sensorId:string, timestamp:string, value:double, anomaly: bool )
[
    "1", datetime(2023-01-23 10:00:00), 32, false,
    "1", datetime(2023-01-24 10:00:00), 400, true,
    "3", datetime(2023-01-24 09:00:00), 9, false
];
let employees = datatable(name:string, age:long)
[
  "Alice", 32,
  "Bob", 31,
  "Eve", 27,
  "Mallory", 29,
  "Alex", 35,
  "Dave", 45
];
let allReports = datatable(employee:string, manager:string)
[
  "Bob", "Alice",
  "Alice", "Dave",
  "Eve", "Mallory",
  "Alex", "Dave"
];
let operates = datatable(employee:string, machine:string, timestamp:datetime)
[
  "Bob", "Pump", datetime(2023-01-23),
  "Eve", "Pump", datetime(2023-01-24),
  "Mallory", "Press", datetime(2023-01-24),
  "Alex", "Conveyor belt", datetime(2023-01-24),
];
let assetHierarchy = datatable(source:string, destination:string)
[
  "1", "Pump",
  "2", "Pump",
  "Pump", "Press",
  "3", "Conveyor belt"
];
員工、感測器和其他實體和關聯性不會共用標準數據模型。 您可以使用 等位運算符 來合併和規範數據。
下列查詢會聯結感測器數據與時間序列數據,以尋找具有異常讀數的感測器。 然後,它會使用投影來建立圖形節點的通用模型。
let nodes =
    union
        (
            sensors
            | join kind=leftouter
            (
                timeseriesData
                | summarize hasAnomaly=max(anomaly) by sensorId
            ) on sensorId
            | project nodeId = sensorId, label = "tag", properties = pack_all(true)
        ),
        ( employees | project nodeId = name, label = "employee", properties = pack_all(true));
邊緣會以類似的方式轉換。
let edges =
    union
        ( assetHierarchy | extend label = "hasParent" ),
        ( allReports | project source = employee, destination = manager, label = "reportsTo" ),
        ( operates | project source = employee, destination = machine, properties = pack_all(true), label = "operates" );
使用標準化的節點和邊緣數據,您可以使用make-graph 運算元建立圖形,如下所示:
let graph = edges
| make-graph source --> destination with nodes on nodeId;
建立之後,請定義路徑模式,並投影所需的資訊。 模式會從標記節點開始,後面接著資產的可變長度邊緣。 該資產是由操作員操作,該操作員會透過可變長度邊緣向最高經理報告,稱為 reportsTo。 在此實例中,圖表比對運算符的條件約束區段會將標籤縮減為具有異常且在特定日運作的標籤。
graph
| graph-match (tag)-[hasParent*1..5]->(asset)<-[operates]-(operator)-[reportsTo*1..5]->(topManager)
    where tag.label=="tag" and tobool(tag.properties.hasAnomaly) and
        startofday(todatetime(operates.properties.timestamp)) == datetime(2023-01-24)
        and topManager.label=="employee"
    project
        tagWithAnomaly = tostring(tag.properties.tagName),
        impactedAsset = asset.nodeId,
        operatorName = operator.nodeId,
        responsibleManager = tostring(topManager.nodeId)
輸出
| tagWithAnomaly | impactedAsset | operatorName | responsibleManager |
|---|---|---|---|
| 溫度 | 泵 | Eve | 馬婁裡 |
圖形比對中的投影會輸出溫度感測器在指定日期顯示異常的資訊。 它是由伊芙經營的,他最終向馬婁里報告。 利用這項資訊,工廠經理可以連絡 Eve,並可能連絡 Mallory,以進一步瞭解異常狀況。
