Parallel Loops and PLINQ Queries in the Concurrency Visualizer
There are two types of Scenario Marker in the Concurrency Visualizer: those which you instrument yourself to demarcate user-defined application phases and those which appear automatically and demarcate particular runtime constructs. While Hazim Shafi has previously written a blog entry describing the first type, we have yet to discuss the second type, which is the topic of this entry.
This type of Scenario Marker demarcates the following runtime constructs:
- PLINQ queries
- Parallel.For loops in the Task Parallel Library (TPL)
- parallel_for loops in the Parallel Patterns Library (PPL)
They differ in behavior from the type of markers described by Hazim in two ways. First, they appear automatically in the Concurrency Visualizer (you do not need to instrument your code). Second, they only appear in the Threads View and Cores View (not the CPU Utilization View).
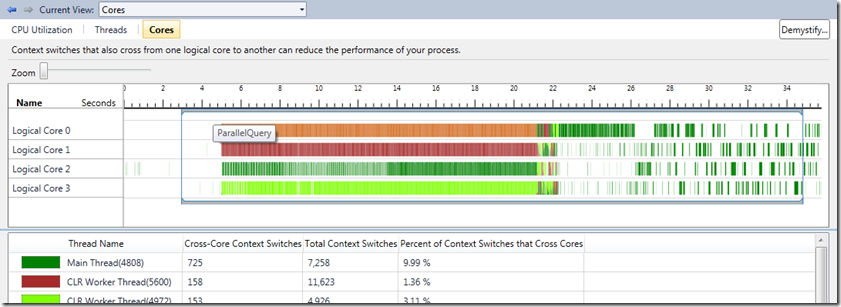
PLINQ Queries
PLINQ queries are automatically demarcated by Scenario Markers when viewed in the Concurrency Visualizer. The endpoints represent the beginning and end of the query:
TPL Parallel.For
TPL Parallel.for loops are automatically demarcated by Scenario Markers. The endpoints of the marker correspond to the beginning and end of an individual parallel loop:
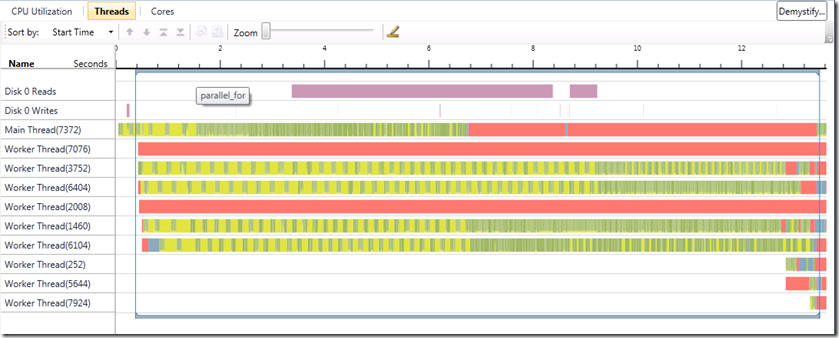
PPL parallel_for
PPL parallel_for loops are demarcated by Scenario Markers but you must opt in. Note that this differs from its managed counterpart (described above). Simply make a call to Concurrency::EnableTracing() and the Concurrency Visualizer will display these loops:
Conclusion
The behavior of these markers differs slightly from the type of Scenario Markers which are described in Hazim’s blog entry and we haven’t gotten much feedback on that difference. One person has voiced an opinion on the matter in this forum thread:
The Scenario object on MSDN is great for marking the beginning and end of processing regions. Unfortunately, the Visualizer is also picking up the Parallel.For and PLINQ markers as well. Is there any way to get the Visualizer to ignore the internal Scenario markers so that I can just focus on my own? If I want to see where a Parallel loop is being executed, I'll insert the marker myself ;)
On the other hand, some folks prefer to visualize these runtime constructs without any required work on their end.
I’d love to hear your preference. Do you prefer markers for parallel loops and PLINQ queries to appear automatically or do you prefer to instrument them yourself? Leave a comment below.
James Rapp – Parallel Computing Platform
Comments
Anonymous
July 11, 2011
My vote is for the parallel loops and PLINQ queries to appear automatically - I find it really useful.Anonymous
July 12, 2011
Hi Stuart - Thanks for the feedback. As we're currently working on the next wave of Concurrency Visualizer features, we're always look for areas, like this, where we can improve. Feel free to email me (by clicking the "Email blog author" link) or just comment here if you have any other feedback or questions.


