This entry will demonstrate the use of Concurrency Visualizer profile reports to locate the source of lock contention in a parallel matrix multiplication app.
The Problem
In this hypothetical example, suppose that my coworker, a more junior developer, was asked to parallelize a matrix multiplication algorithm. He parallelized the algorithm using the .NET Thread Pool. Unfortunately, he is not achieving any speedup. He sends his code to me for help. The first thing I do is run the application sequentially and in parallel to compare the times:
Sure enough, the parallel Thread Pool implementation actually takes longer than the sequential version!
Uncovering the Root Cause
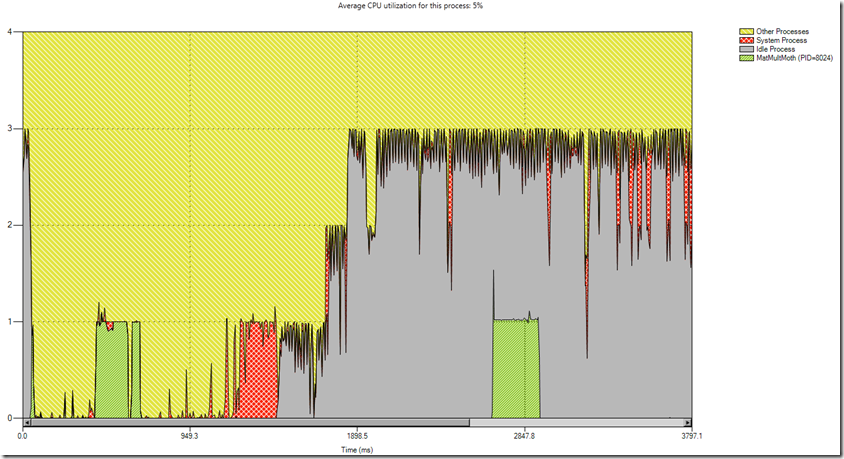
Naturally, the first step is to profile my coworker’s application using the Concurrency Visualizer. Starting with the CPU utilization view, this is what I see:
I can see that the first run of the application (which was sequential) appears as the green block to the left. This tells me that, as expected, the application utilized the equivalent of one core on my four core processor.
There is a lot of inactivity in between, but I can see that my application also utilized the equivalent of one core during the parallel run. This is the first sign that something is wrong. I would expect the parallel implementation to utilize more than one core on the CPU. Ideally, it would use all four.
As the next step, I zoom to the region of interest (the region of parallel execution) in the CPU Utilization View. I then flip to the threads view for a deeper investigation. Since I zoomed to a specific region in time in the CPU Utilization View, I am now viewing that same time region in the Threads View. In other words, the level of zoom and position of pan is maintained while switching among views. Here is what I see in the Threads View:
While I can see that my coworker effectively divided the work onto multiple threads (with the help of the Thread Pool), none of it actually executes concurrently. When you look closely, you can see that none of the green execution segments overlap. Meanwhile, there is a substantial amount of synchronization (red segments). I suspect that this excessive synchronization is the culprit.
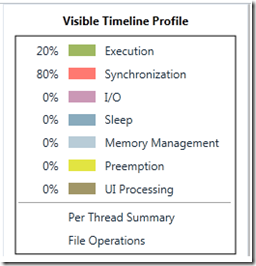
To get a better understanding of the problem, I click the red synchronization category of the Visible Timeline Profile. This reveals all of the call stacks responsible for synchronization in the current visible time range, sorted by cumulative time spent there. I can see that (in this case) there is only one call stack responsible for all of the synchronization. After fully expanding it, I can see this report:
I can see that my code makes a call to a blocking API, which eventually leads to exclusive blocking time in the “WaitForMultipleObjects” Windows API. Thus, the report shows me that this call stack is responsible for all of the synchronization shown in the Threads View. Therefore, I right-click the first non-user-code function and select “View Call Sites” to find all lines in my code which called this function:
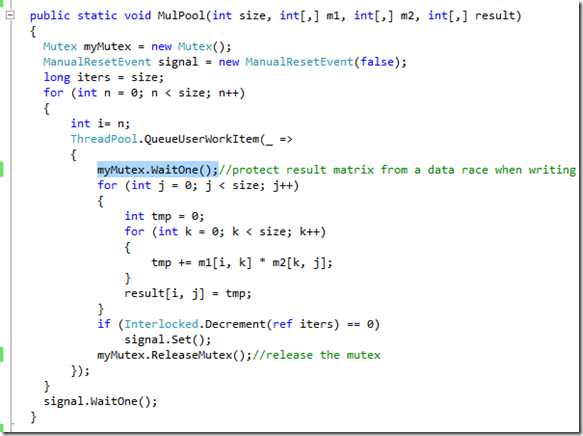
If there were multiple places in my application which made the call to this function, I would see a list of them. In this case, there was only one place in my application which made the call to this function, so I am taken directly to that line of code:
I can see that I am now in the “MulPool” function, which is my coworker’s Thread Pool implementation. The line of code responsible for the synchronization call is automatically highlighted. I can see that my coworker is using a mutex to protect the result array from a potential data race when the various threads update it. The call to “WaitOne” here resulted in the series of calls eventually leading to the “WaitForMultipleObjects” call shown in the profile report.
While multiple threads update the result array concurrently, no two threads ever need to access to the same cell in the result array. So based on my knowledge of this algorithm, I know that the mutex is unnecessary.
To fix this, I simply need to remove the mutex. Of course, I will test the fix to make sure I am still getting correct results.
Verifying the Fix
After verifying that I am still getting correct results, I want to verify performance improvements. I re-run the application:
I am now pleased to see that the parallel implementation is running roughly 2.45 times faster than the sequential implementation. Just to be sure, I profile it again to see what’s happening under the covers:
The CPU Utilization View now reveals that the parallel implementation used the full power of the CPU. I can switch to the Threads View (after zooming to the parallel region) and verify that the threads are executing efficiently:
The four threads performing the calculation are now mostly spending their time executing, with minimal time spent in a blocking state. I can now see why my application is running faster.
Conclusion
Uncovering the root cause of performance problems in parallel applications can be a difficult task, even for the most experienced professionals. The Concurrency Visualizer provides a bevy of alternatives to help developers attack performance problems. In this case, we saw how the profile reports, which are accessible via the Visible Timeline Profile, can help you to locate performance problems. Sometimes the behavior of your application is best understood at an aggregate level, rather than viewing isolated call stacks or thread segments.
James Rapp – Parallel Computing Platform
Comments
- Anonymous
May 23, 2014
Great article!


