Azure Log Analytics: Using Perfmon data
Updated: As last night the Settings moved to the Azure portal
Today I was looking at Perfmon data for a particular process. In this case it happened to be lsass.exe but only on Domain Controllers.
I needed to add this Perfmon Counter to OMS, in Settings - Data - Windows Performance Counters (via the OMS portal not the Azure portal). in the Azure portal.
I added the counter called:
| Process(*)\% Processor Time |
I also set the Sample Interval to 300 seconds rather than the default 10secs...now is a good time for a coffee/tea to allow the data to start to flow.
After my coffee break, I dis a quick check to see if lsass was being captured, in the Advanced Analytics portal I typed:
Perf
| search "lsass"
When the data appeared, I amended the query to just show the info from computers that start with DCnnnn (which is true in my environment, edit to suit), I also filtered on ObjectName and InstanceName to be more precise on where I picked the string lsass up from
Perf
| where TimeGenerated > ago(1d)
| where ObjectName == "Process" and InstanceName == "lsass" and Computer startswith "DC"
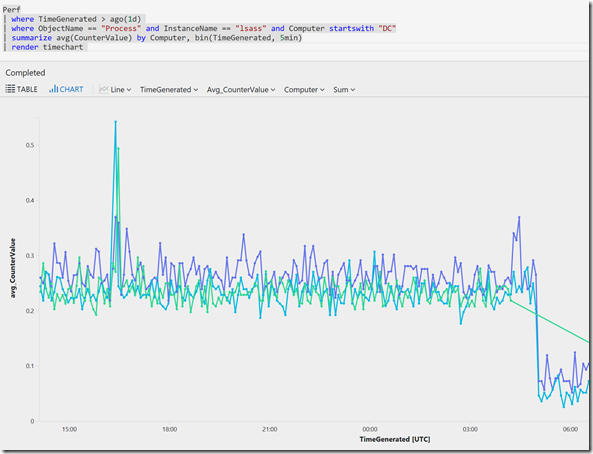
In the end I wanted to make sure I could see each computer separately on a Line Chart and also restrict the data to One day (always good practise not to pull too much data) and to show in 5minute intervals
Perf
| where TimeGenerated > ago(1d)
| where ObjectName == "Process" and InstanceName == "lsass" and Computer startswith "DC"
| summarize avg(CounterValue) by Computer, bin(TimeGenerated, 5min)
| render timechart


