Monitoring service levels in ops Mgr r2
I’ve just been playing with the new Service Level Dashboard for System Center Operations Manager 2007 R2. It’s a great improvement on the first version, and it’s pretty straightforward to set up. I thought I’d document the steps I took to configure it, although if you just follow through the documentation you’ll get there pretty easily.
First the prerequisites:
1. Install Operations Manager 2007 R2
2. Install Windows SharePoint Services 3.0 (You need to install against SQL, not against the internal Windows database)
3. You’ll need to import the Service Level Dashboard management pack into Ops Mgr
4. Install the Service Level Dashboard following the wizard – it’s pretty straightforward.
5. Make the following change to the web.config file for the Service Level Dashboard application that gets created (by default it’s stored in C:\inetpub\wwwroot\wss\VirtualDirectories\51918) and change the line that reads:
<identity impersonate=”false”> to:
<identity impersonate=”true”>
You’ll need to run iisreset after you’ve done this. If you don’t do this, you’ll get a “Cannot complete this action” when you navigate to the home page.
6. Make sure to create a firewall exception for the port that you’ve configured for the Service Level Dashboard.
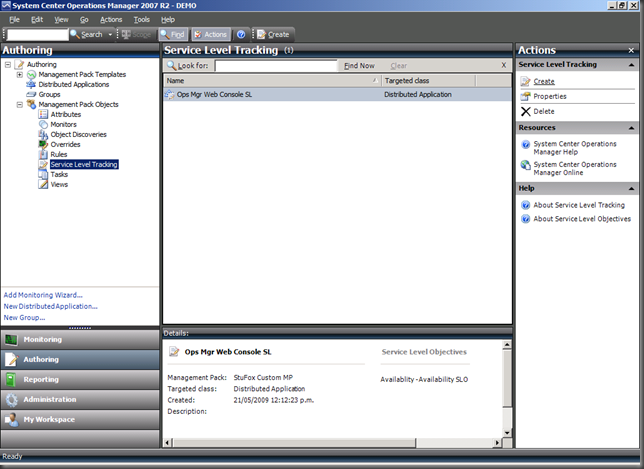
Now you should be good to go. First thing you need to do is define your service level in the Operations Manager console. Open the console and go to the Authoring pane. Choose the “Service Level Tracking” option.
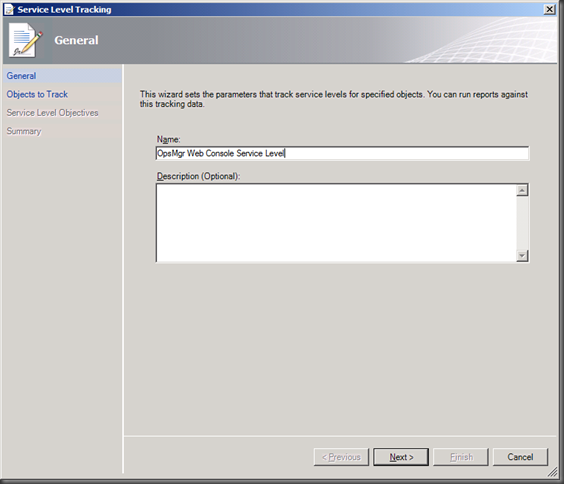
In the right hand pane, click Create. This brings up the Service Level Tracking wizard. Give it a name.
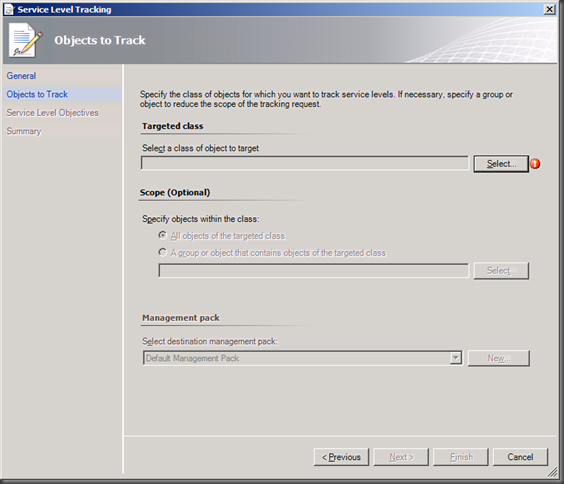
Now we need to define what we’re interested in tracking for service levels.
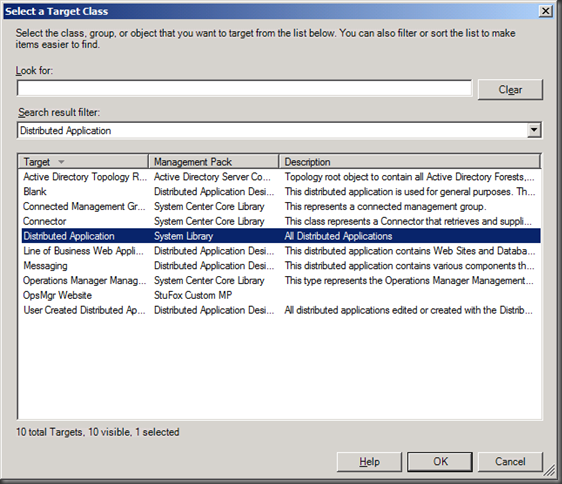
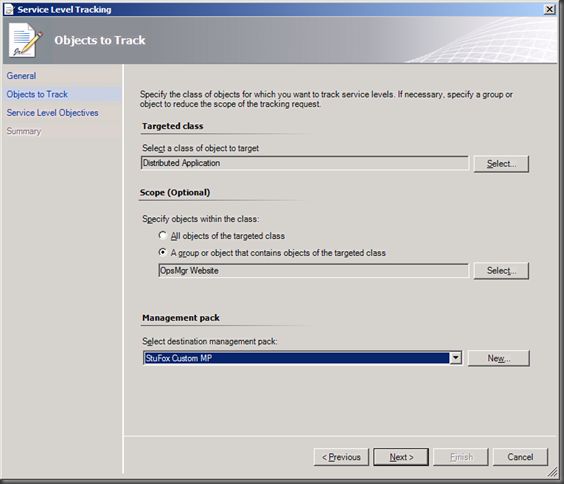
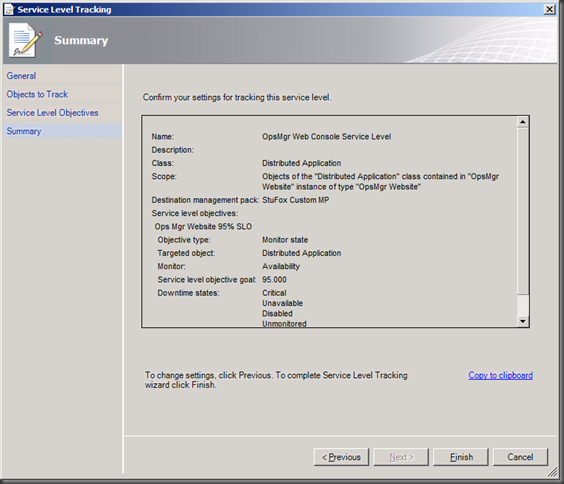
The first thing we need to do is select the class that we’re monitoring. Click the top Select button and choose the class that matches what you’re interested in. By default it’s scoped to Distributed Application, but you can change this to Group or All. In this case I’m interested in tracking one of my pre-created distributed applications, so I choose “Distributed Application” from the list.
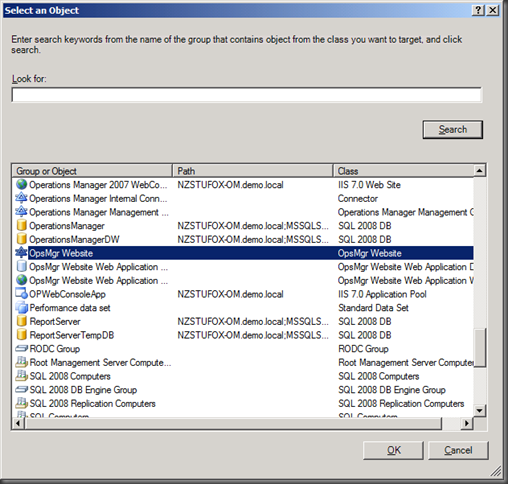
Now we’ve selected our class, we need to target to a specific object – in this case I’m looking for my distributed application called “OpsMgr Website”. This is a distributed application I created based on the “Line of business web application template” – it monitors the OpsMgr web console & backend database of the OpsMgr server itself.
Also make sure you choose a management pack to store this new service level in.
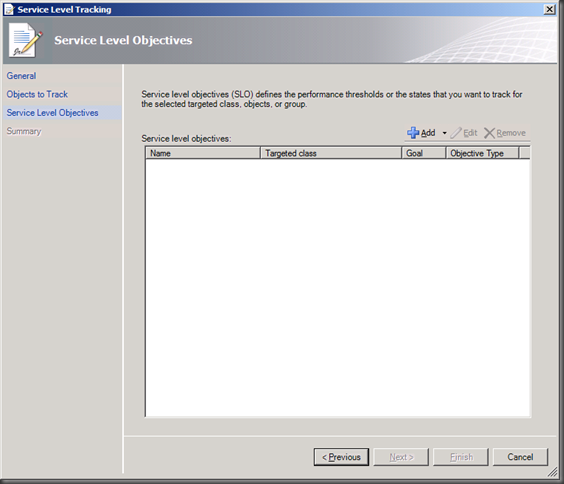
Now we need to define what our service level objective actually is
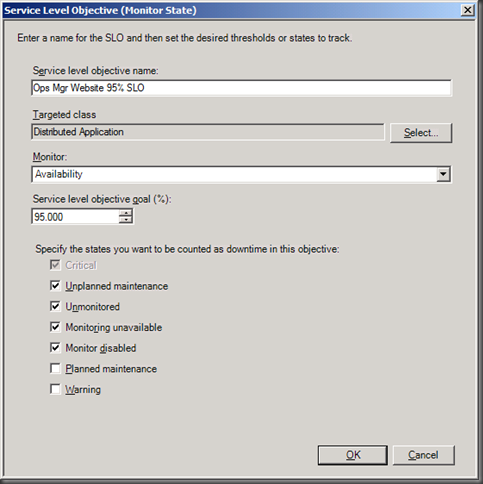
Click the Add button and we can define what we want our service level objective to be. I want my app to available at least 95% of the time and I can specify which states count as downtime.
Once I’ve done this, I can now create the service level tracking.
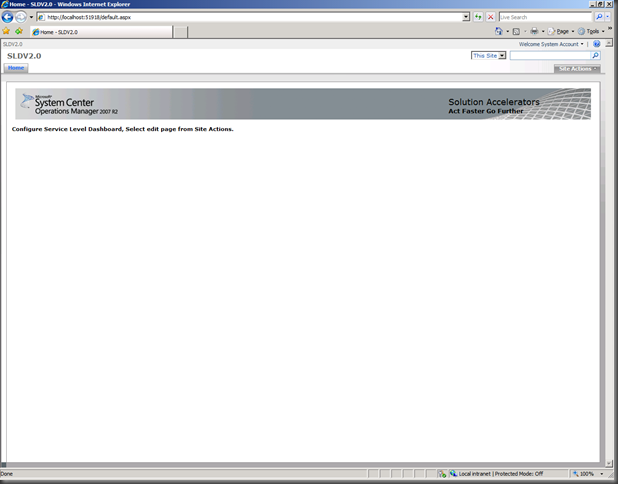
Now that I’ve defined what I need to track, I can then go to the Service Level Dashboard and setup the web page that lets me view this. Navigate to the website you set up when installing the service level dashboard (by default it’s https://localhost:51918). It’s also blank by default. Make sure you log on as an Administrator of the site so that you can make changes.
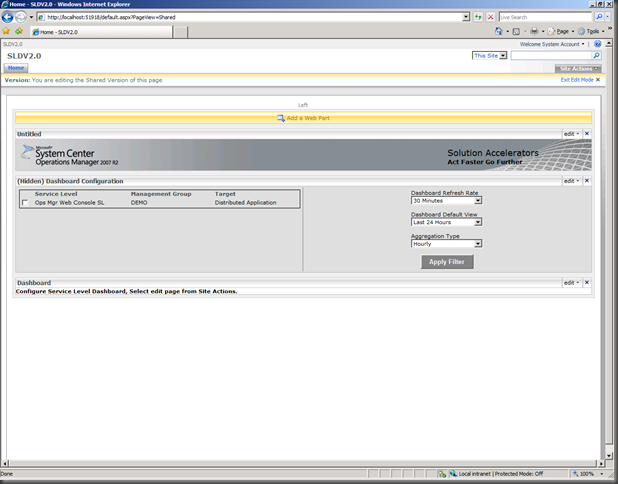
Go to the Site Actions button, and choose Edit Page. This will bring up the screen below and, all things going well, you should have your service level that you’ve defined available to select. Choose the one you want to monitor, and choose the refresh rate and over what period you want to report. Once you’re done, exit edit mode.
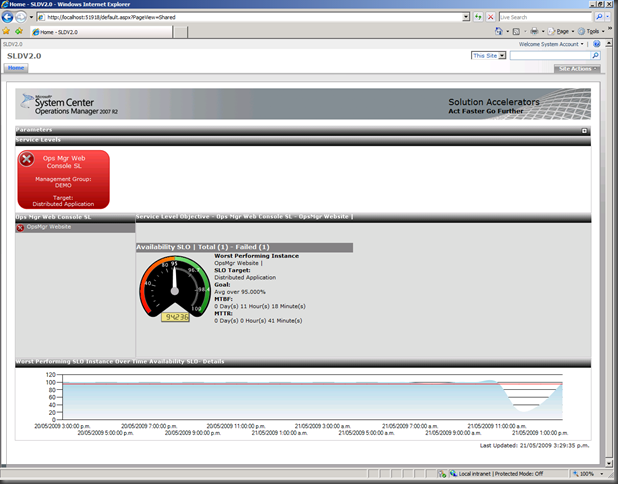
You should now have a nice view of how you’re tracking against your service levels – you can see that I’m not meeting my 95% objective (that’s what happens when you stop the web console web site for a few hours…)
As you can see, the new version of the Service Level Dashboard is easy to set up and provides a great view of how you’re tracking.
Comments
Anonymous
August 13, 2009
Something to note: When installing you need to install as a user with access to the OpsManager Data warehouse database AND the permissions to create Sharepoint Sites and access to the Sharepoint Database. Otherwise PAIN!Anonymous
March 30, 2011
Hello, I have done this and it was working for a week buit now I could not see the SLOs available in the dashboard? " Go to the Site Actions button, and choose Edit Page. This will bring up the screen below and, all things going well, you should have your service level that you’ve defined available to select. Choose the one you want to monitor, and choose the refresh rate and over what period you want to report. Once you’re done, exit edit mode." No SLO is dispalyed? I have the Edit Web Part but thats it ??? Thanks, Dom
