SQLSweet16!, Episode 8: How SQL Server 2016 Cumulative Update 2 (CU2) can improve performance of highly concurrent workloads
Sanjay Mishra, Arvind Shyamsundar
Reviewed by: Dimitri Furman, Denzil Ribeiro, Mike Ruthruff, Mike Weiner, Ryan Stonecipher, Nitish Upreti, Panagiotis Antonopoulos, Mirek Sztajno
Last year, in the SQLCAT lab we were working with an early adopter customer running pre-release SQL Server 2016 on Windows Server 2016 Tech Preview 4. The workload being used was the ASP.NET session state workload: the session state data was stored in a non-durable memory-optimized table and for best performance, we used natively compiled stored procedures.
In the lab tests, we were easily able to exceed the performance of the same workload running on SQL Server 2014 with comparable hardware. However, at some point, we found that CPU was our sole bottleneck, with all the available CPUs maxed out at 100% usage.
Now, on one hand we were glad that we were able to maximize the CPU usage on this system – this was because in SQL Server 2016, we were able to natively compile all the stored procedures (which was not possible earlier in in SQL Server 2014 due to some T-SQL syntax not being supported in native compiled procedures.)
We started our investigation by using the regular tools such as DMVs, performance counters and execution plans:
- From performance counter data, we could see that the SQL Server process (SQLServr.exe) was taking up the bulk of CPU time. The OS and device driver CPU usage (as measured by the %Privileged Time counter) was minimal.
- From DMVs, we identified the top queries which were consuming CPU time and looked at ways to optimize the indexes on the memory-optimized tables and T-SQL code; those were found to be optimal.
- There was no other evident bottleneck, at least from a user-controllable perspective.
At this point it was clear we needed to ‘go deeper’ and look at the lower-level elements within the SQL process contributing to CPU usage on this box to see if we could optimize the workload further.
Going Deeper
Since this was a high CPU problem and we wanted to get right to the ‘guts’ of the issue, we used the Windows Performance Toolkit, a great set of tools provided as part of the Windows SDK. Specifically, we used the command line tool called XPERF to capture a kernel level trace of the activity on the system. Specifically, we used a very basic and relatively lightweight capture initiated by the following command line:
xperf -On Base
This command ‘initializes’ a kernel logger which starts capturing critical traces. To stop the tracing (and we did this within a minute of starting, because these traces get very large very quickly!) we issued the following command:
xperf -d c:\temp\highcpu.etl
For the purposes of this post, we reproduced the ASP.NET session state workload with SQL Server 2016 RTM (the final released version) in the lab, and collected the XPERF trace as our ‘baseline’. Later in this post, we will compare how things look with SQL Server 2016 Cumulative Update 2.
Analyzing the Trace
The output produced by the above command is an ETL file which can then be analyzed using the Windows Performance Analyzer (WPA) tool. WPA is typically run on another system, in my case it was my own laptop where I had access to the Internet. The reason Internet access is important is because WPA can use ‘symbol files’ which contain more debugging information, specifically the DLL and function names associated with the machine code which was found to be running on the CPU during the trace collection. Once we get function names, it is generally much easier to understand the reason for the high CPU usage.
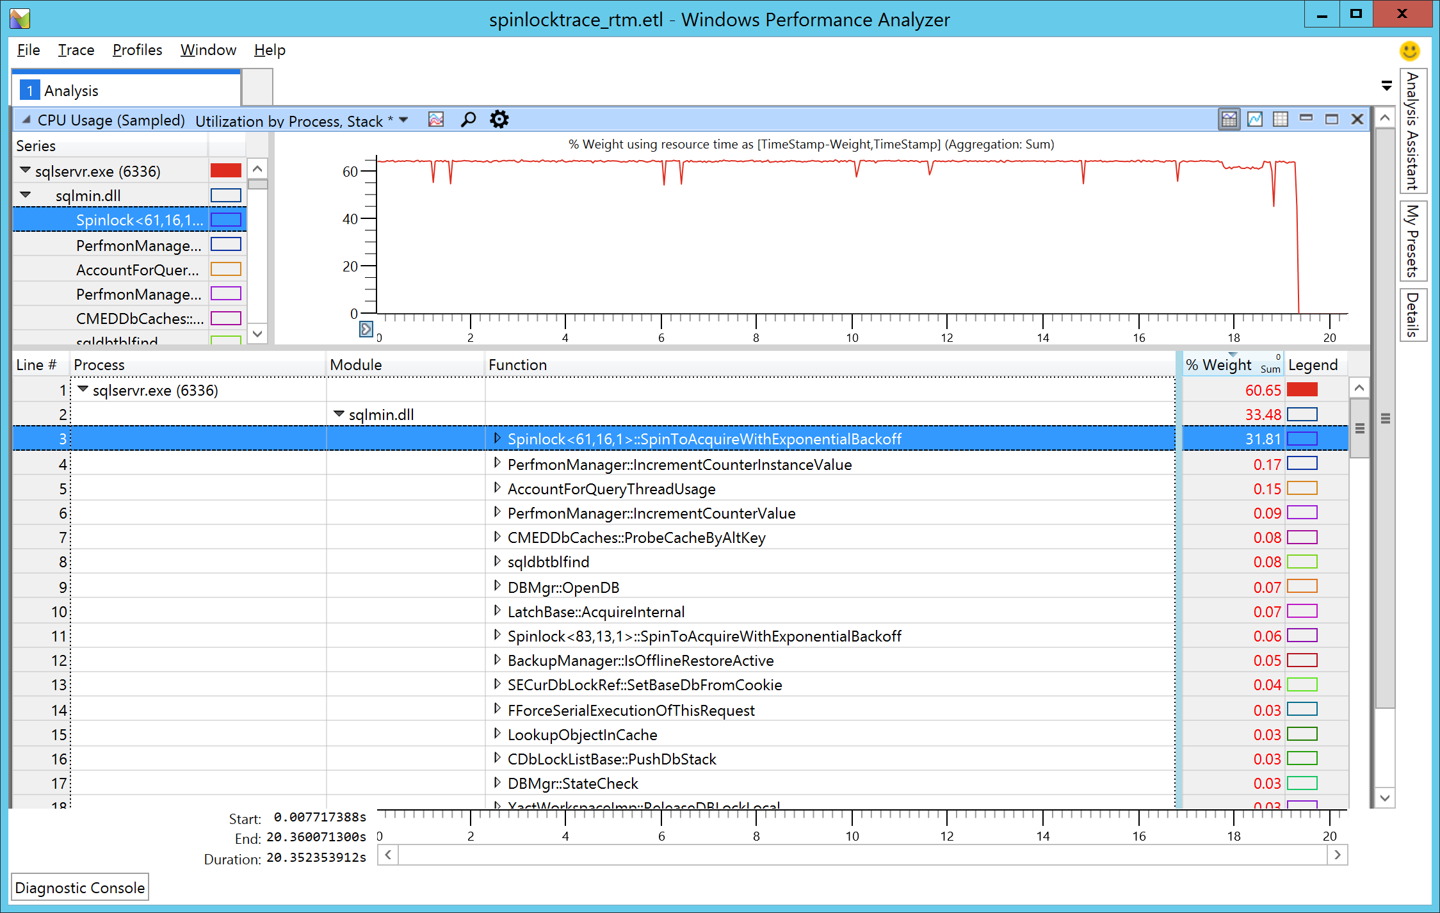
When we used WPA to analyze the ETL trace collected for the workload running on the RTM installation of SQL Server 2016, we obtained the following result.
[caption id="attachment_4525" align="alignnone" width="1440"] Figure 1: SQL Server 2016 RTM[/caption]
The important thing to notice is the function which starts with the words Spinlock<61,16,1>. Notice that the %Weight column for that row is 31.81% which is a sizeable number. To break this down further, we must query the sys.dm_xe_map_values view:
 SELECT *
FROM sys.dm_xe_map_values
WHERE map_key = 61
AND name = 'spinlock_types';
Here is the spinlock associated with the number 61. We get this ‘magic number’ from the output in the XPerf trace. The name of this spinlock with the key 61 is CMED_HASH_SET:
For more information on how to troubleshoot spinlocks and why they can on occasion cause high CPU usage, please refer to this guidance paper which is still very relevant even though it was written in the SQL Server 2008 timeframe. One change to note for sure is that the whitepaper refers to the older ‘asynchronous_bucketizer’ targets for identifying the call stack for the spinlocks with the most contention. In later versions of SQL Server, we need to use the ‘histogram’ target instead. For example, we used this script to create the extended event session:
 CREATE EVENT SESSION XESpins
ON SERVER
ADD EVENT sqlos.spinlock_backoff
(ACTION
(package0.callstack)
WHERE type = 61
)
ADD TARGET package0.histogram
(SET source_type = 1, source = N'package0.callstack')
WITH
( MAX_MEMORY = 32768KB,
EVENT_RETENTION_MODE = ALLOW_SINGLE_EVENT_LOSS,
MAX_DISPATCH_LATENCY = 5 SECONDS,
MAX_EVENT_SIZE = 0KB,
MEMORY_PARTITION_MODE = PER_CPU,
TRACK_CAUSALITY = OFF,
STARTUP_STATE = OFF
);
We use the extended event session output to validate the ‘call stack’ (the sequence of calls which led to the spinlock acquisition calls.) This information is very useful for the engineering team to understand the root cause of the spinlock contention, which in turn is useful to arrive at possible fixes.
Why is this spinlock a bottleneck?
The spinlock bottleneck described in this blog post is especially prominent in this ASP.NET session state workload, because everything else (natively compiled procedures, memory optimized tables etc.) is so quick. Secondly, because these spinlocks are shared data structures, contention on them becomes especially prominent with larger number of CPUs.
This CMED_HASH_SET spinlock is used to protect a specific cache of SQL Server metadata, and the cache is looked up for each T-SQL command execution. At the high levels of concurrency (~ 640000 batch requests / second), the overhead of protecting access to this cache via spinlocks was a huge chunk (31.81%) of overall CPU usage.
The other thing to note is that the cache is normally read-intensive, and rarely updated. However, the existing spinlock does not discriminate between read operations (multiple such readers should ideally be allowed to execute concurrently) and write operations (which have to block all other readers and writers to ensure correctness.)
Fixing the issue
The developers then took a long hard look at how to make this more efficient on such large systems. As described before, since operations on the cache are read-intensive, there was a thought to leverage reader-writer primitives to optimize locking. However, any changes to this spinlock had to be validated extensively before releasing publicly as they may have a drastic impact if incorrectly implemented.
The implementation of the reader / writer version of this spinlock was an intricate effort and was done carefully to ensure that we do not accidentally affect any other functionality. We are glad to say that the final outcome, of what started as a late night investigation in the SQLCAT lab, has finally landed as an improvement which you can use! If you download and install Cumulative Update 2 for SQL Server 2016 RTM, you will observe two new spinlocks in the sys.dm_os_spinlock_stats view:
- LOCK_RW_CMED_HASH_SET
- LOCK_RW_SECURITY_CACHE
These are improved reader/writer versions of the original spinlocks. For example, LOCK_RW_CMED_HASH_SET is basically the replacement for CMED_HASH_SET, the spinlock which was the bottleneck in the above case.
CU2 Test Results
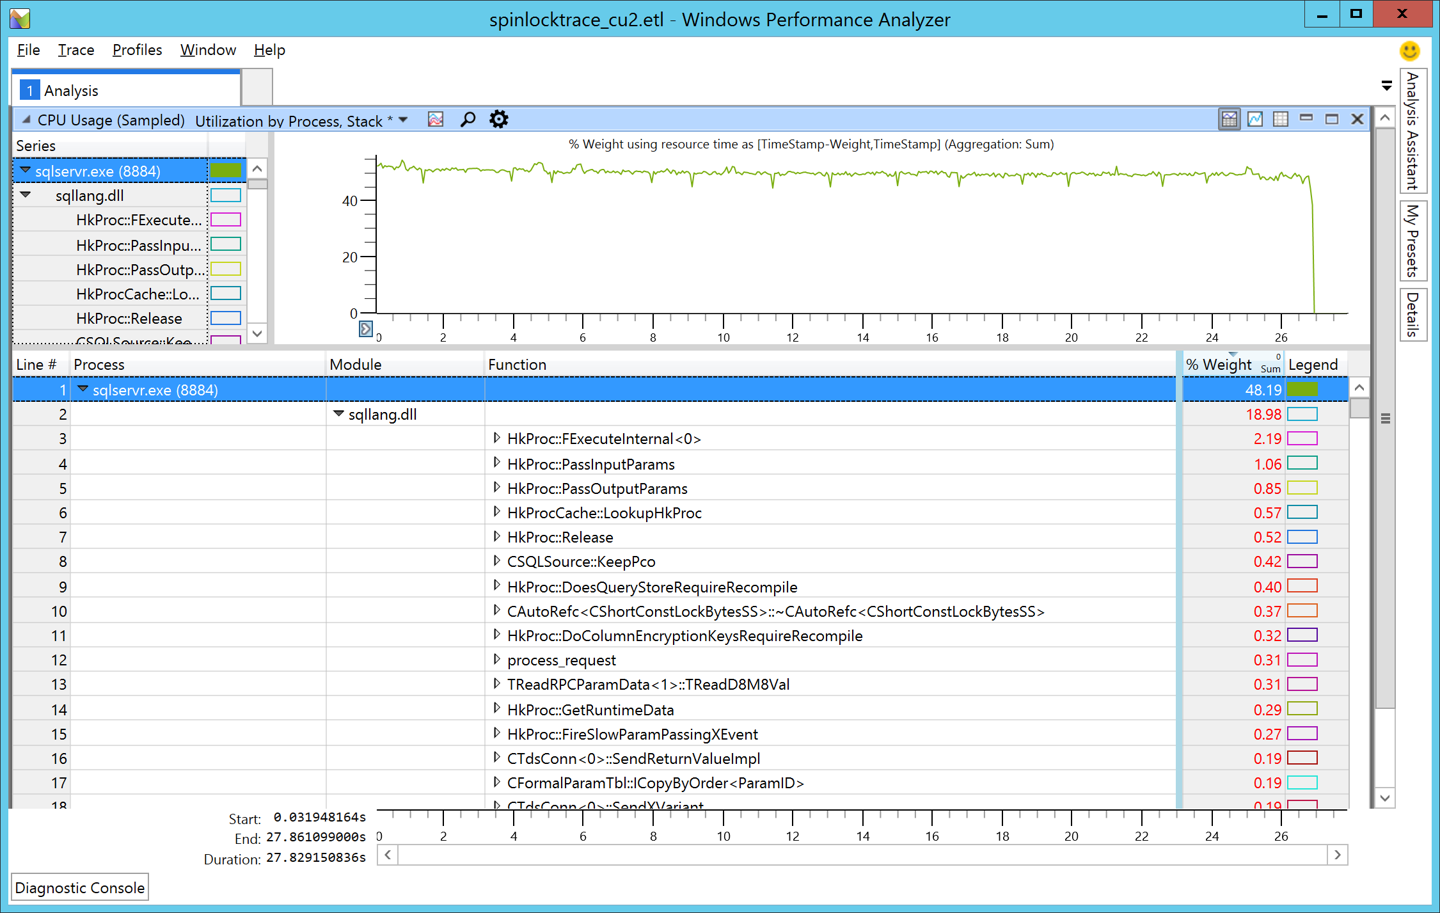
Putting this to the test in our lab, we recently ran the same workload with CU2 installed. For good measure, we collected a similar XPERF trace. On analyzing the XPERF trace, we can clearly see the spinlock is gone from the top consumer list, and that we have some in-memory OLTP code (as identified by the HkProc prefixes) on top of the list. This is a good thing because our workload is comprised of natively compiled procedures and that is getting most of the time to execute!
[caption id="attachment_4535" align="alignnone" width="1440"] Figure 2: SQL Server 2016 CU2[/caption]
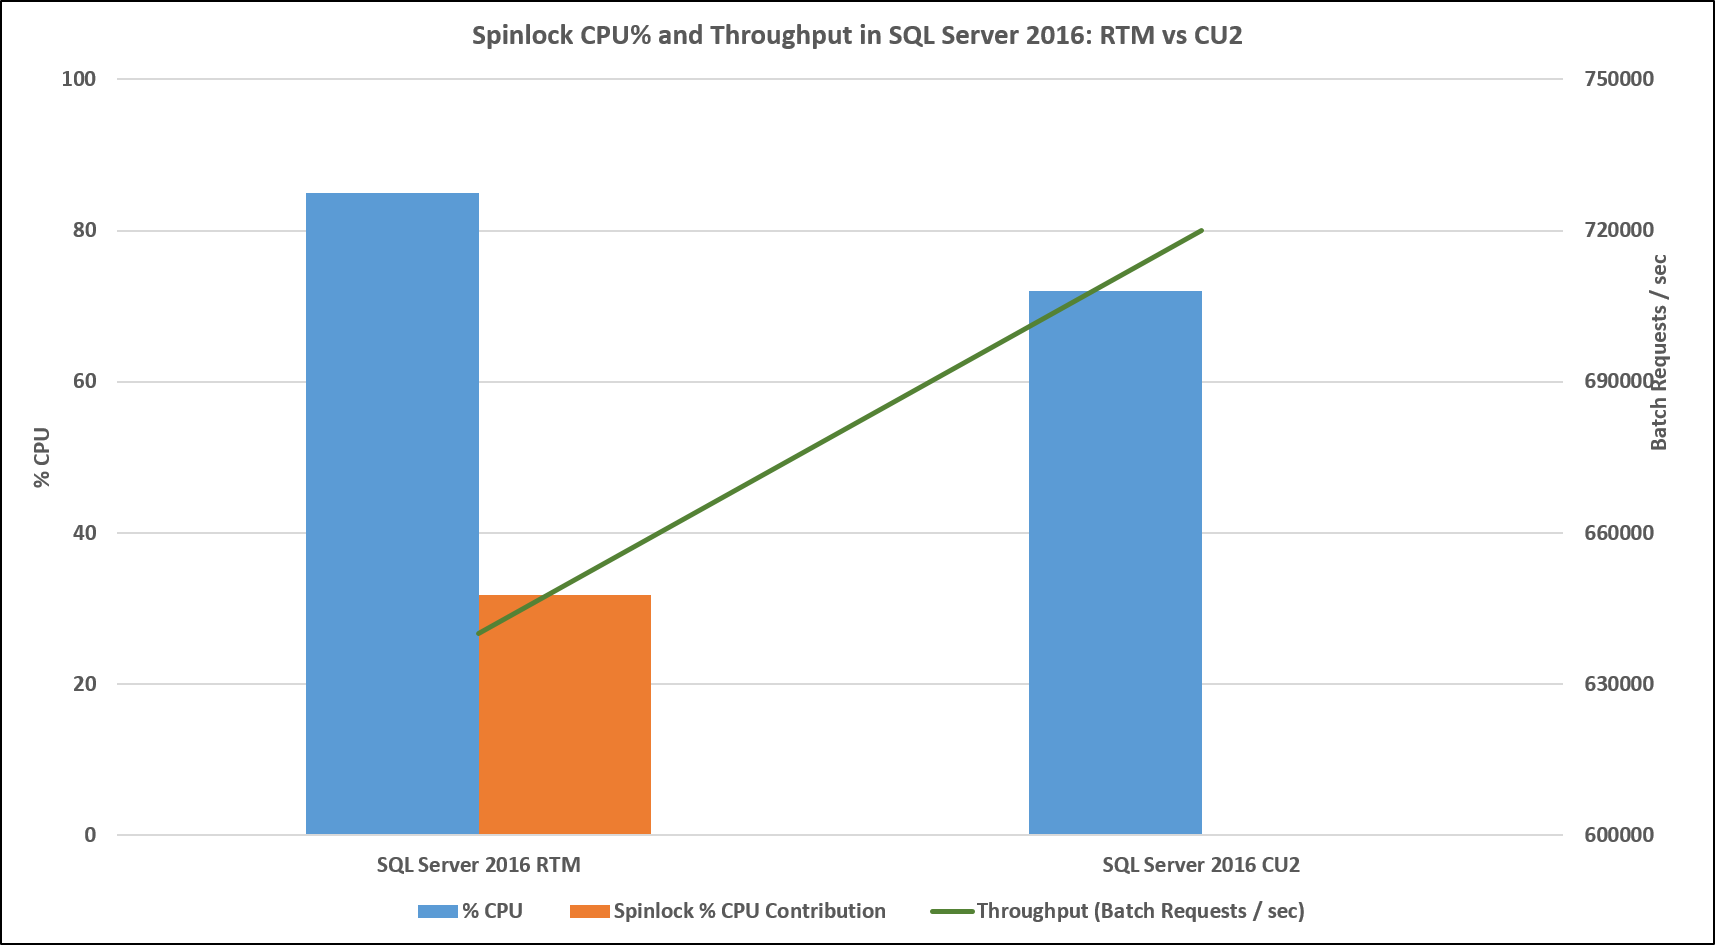
We saved the best for the last! The results of the workload test against CU2 speak for themselves:
[caption id="attachment_4605" align="alignnone" width="1715"] Figure 3: Spinlock CPU% and Throughput in SQL Server 2016: RTM vs CU2[/caption]
| RTM | CU2 | |
| % CPU | 85 | 72 |
| Spinlock % CPU Contribution | 30 | Not observed |
| Throughput (Batch Requests / sec) | 640000 | 720000 |
As you can see, there was an almost 13% improvement in workload throughput, at a corresponding reduced CPU usage of 13%! This is great news for those mission critical workloads, because you can do even more in the headroom made available now.
Conclusion
Hardware is constantly evolving to previously unthinkable levels. Terabytes of RAM and hundreds of cores on a single server is common today. While these ‘big boxes’ eliminate some classic bottlenecks, we may end up unearthing newer ones. Using the right tools (such as XPerf, WPA, XEvents in the above example) is critical to precisely identifying the bottleneck.
Finally, identifying these issues / tuning opportunities during the pre-release phase of the product lifecycle is really useful as it gives adequate time for the appropriate fixes to be thought through, implemented correctly, validated in lab tests and then finally released.
We hope you enjoyed this walkthrough! Do let us know if you have any questions or comments. We are eager to hear from you!
Comments
- Anonymous
September 29, 2016
Very good piece of work and the usage of xperf/wpr is great for this scenarios.PS: It would be nice if SQL Server was properly written in the charts.- Anonymous
October 03, 2016
Thanks Paulo. I fixed the typo.
- Anonymous
- Anonymous
September 30, 2016
This is awesome. Thank you for the detailed walk-thru. - Anonymous
October 03, 2016
The comment has been removed- Anonymous
October 03, 2016
Thanks Chris - the blog post was based on a actual lab engagement hence the mention of the 144 processor machine. It is good to point out similar contention can happen even on a 20 processor machine, thank you for pointing this out. Did you have a chance to test this workload with SQL 2016 RTM and compare it with SQL 2016 CU2?
- Anonymous
- Anonymous
October 05, 2016
I really appreciate the time it takes to do such lab testing and then to report on it, as was done in this article. Thank your for that.Shifting gears a bit, lab testing is fine but it's still artificial. What would be really convincing is for you good folks to identify a customer having such problems and fix them with similar great documentation on the "Before'n'After". There's nothing like a real world test to convince people.- Anonymous
November 01, 2016
The comment has been removed
- Anonymous
- Anonymous
October 10, 2016
Performance improvements were noticeable when we tried it out, after a little tweaking.However there were issues in getting the RsFxDriver working for some reason, the digital signature isn't passing validation on Windows Server 2016.- Anonymous
October 19, 2016
Hi Steven - sorry to hear about the issue with the filestream driver on CU2. The SQL Tiger team has described the issue and the workaround here: https://blogs.msdn.microsoft.com/sql_server_team/filestream-rsfx-driver-fails-to-load-after-installing-sql-server-2016-with-cu2-on-windows-server-2016-with-secureboot-on/
- Anonymous
- Anonymous
October 24, 2016
This behavior is also present in SQL 2014 SP2 CU1.Will the be addressed in the next CU?- Anonymous
October 28, 2016
Unfortunately, I don't think that will be possible. The work involved internally to make the RW_ equivalents of the spinlock was quite a lot and it is not anticipated to be backported.
- Anonymous
- Anonymous
August 16, 2017
Good stuff. Very educational. I especially liked extracting the first parameter in the Spinlock template class - 61 - to then go identify the specific spinlock on the XE tables.
![clip_image004[4] clip_image004[4]](https://msdntnarchive.z22.web.core.windows.net/media/2016/09/clip_image0044_thumb.jpg)