SQL Server Performance Dashboard Reports unleashed for Enterprise Monitoring !!!
SQL Server 2012 Performance Dashboard Reports is one of most popular SQL Server monitoring solution for customers and SQL community leveraging dynamic management views (DMVs) for monitoring and reporting and available at no cost to consumers. SQL Server Performance Dashboard Reports are available as a set of custom reports in SQL Server Management Studio (SSMS) which runs against the connected instance in Object Explorer. When monitoring large enterprise deployments of SQL Server, hosting SQL Server Performance Dashboard Reports on a central reporting server can provide additional benefits making life easier for enterprise DBAs for monitoring and troubleshooting SQL Server issues. To support hosting SQL performance dashboard reports on a central SQL Server Reporting Services instance, we have customized SQL Server 2012 Performance Dashboard Reports, added new reports and uploaded in Tiger toobox github repository for customers and SQL community. The reports are tested to run against SQL Server 2012, SQL Server 2014 and SQL Server 2016 versions of target SQL Server instance and can be deployed against SQL Server 2012, SQL Server 2014 or SQL Server 2016 Reporting Services instance.
Following are some of the benefits of hosting SQL Performance dashboard reports on central SSRS reporting server.
- Monitoring Reports accessible anytime, anywhere using browser – This removes the dependency of thick client like SQL Server Management Studio (SSMS) to be present on the workstation server allowing DBAs, DevOps audience to check the health of SQL Server and resource consumption using web browser from any workstation machine with access to the server.
- Scheduling automatic report delivery – SSRS allows scheduled email or file share delivery of reports. This allows DBAs, application owners and database stakeholders to choose push model where by performance health reports can be scheduled to run against specified SQL Server instances at the specified time and be delivered in their mailbox to proactively monitor overall health of SQL Server instance and detect any anomaly.
- Performance Base lining using Report Snapshots – SSRS allows you to capture scheduled point in time report snapshots at the specified time interval allowing DBAs to establish performance baselines using historical snapshots for the target SQL Server instances.
- Linked Reports for Application owners and other stakeholders – In an enterprise environment, most application teams and stakeholders are interested to see the performance, resource consumption, blocking information and overall health of their SQL Server instance on-demand. In such scenarios, DBAs can create linked reports for the target SQL Server instances on the SSRS central server and delegate them permissions to view reports for their target SQL Server instance of interest. This allows application teams, developers to be self-sufficient to check the overall health of their SQL Server instances creating some bandwidth for DBAs who needs to be contacted only if there is an anomaly or problem detected.
Architecture
The following diagram shows high level architecture when deploying SQL Performance Dashboard Reports on a central monitoring SSRS server instance for monitoring all the target SQL Server instances in an enterprise or mid-size deployments of SQL Server.

Setting Up and Configuring SQL Server Performance Dashboard Reports for Monitoring
The following section provides the steps for setting up and configuring SQL Server Performance Dashboard Reports for monitoring.
Install and configure SQL Server Reporting service (any version greater than SQL Server 2012 with latest SP and CU) on a server identified as a Central Monitoring Server. The central monitoring server should be part of the same domain and network as the target SQL Server instance.
Download SQL Performance Dashboard Reporting Solution from Tiger toobox github repository.
Download SSDT-BI for Visual Studio 2012 or Download SSDT-BI for Visual Studio 2013 and install BI designer on workstation where github solution is downloaded or copied.
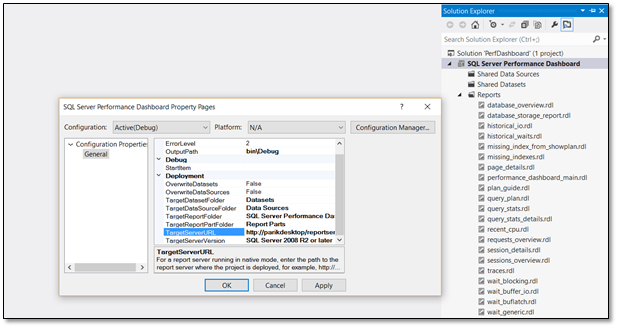
Open PerfDashboard solution using Visual Studio 2012 or 2013 on the workstation and deploy it against the SQL Server Reporting service instance by providing the TargetServerUrl as shown below
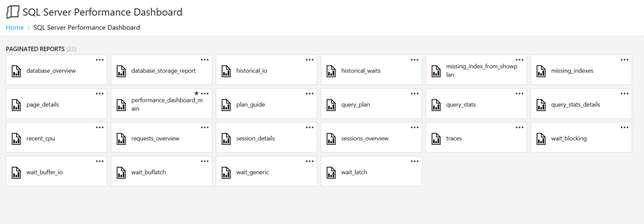
Make sure report deployment is successful and browse the report manager url to see the reports deployed under SQL Server Performance Dashboard folder.
Run setup.sql script from Tiger toobox github repository against all the target SQL Server instances which creates a schema named MS_PerfDashboard in msdb database of SQL Server instance. All the relevant objects required for SQL performance dashboard reports are contained in MS_PerfDashboard schema.
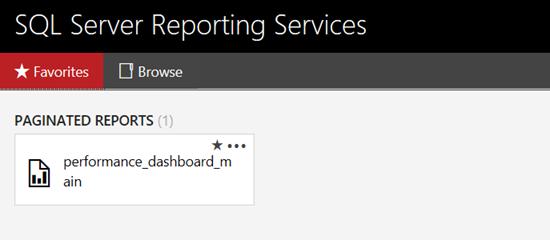
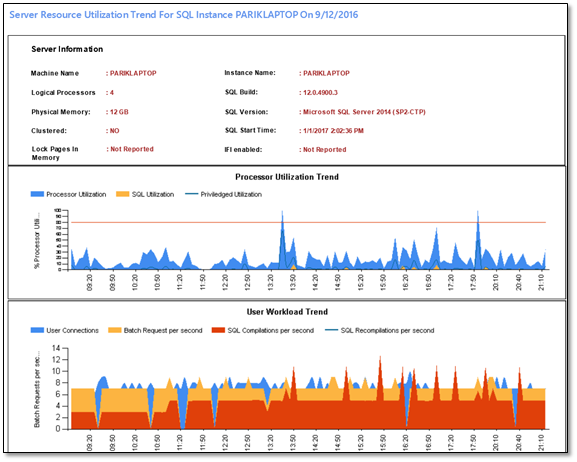
You should always start with performance_dashboard_main report as a landing page and navigate to other reports from the performance dashboard report. If you have deployed the reports against SQL Server 2016 Reporting services instance, you can set performance_dashboard_main report as favorite for easier navigation as shown below.
When you browse performance_dashboard_main report, it will ask you the target SQL Server instance against which you wish to see the report. If setup.sql is ran against the target SQL Server instance, you will see the data populated in the report.

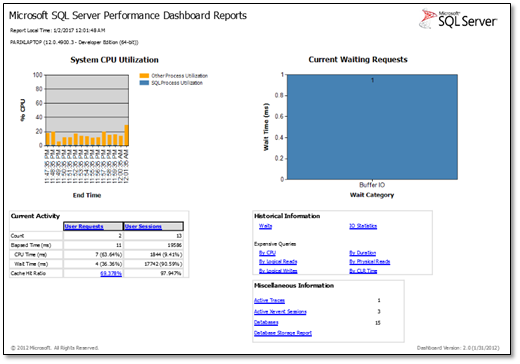
You can further click on the hyperlinks to navigate to that report for further drill through as shown below.

The steps 2-7 above for downloading and deploying SQL Server Performance Dashboard Reports to SSRS instance is completely automated by one of our MVPs Aaron Nelson (b|t) using PowerShell. So, you can skip steps 2-7 above and instead download and run the PowerShell script from github repository here. Following are some of things to know before running the PowerShell scripts
- You need to be running the PowerShell script from the workstation machine which has connectivity to internet, from where you can browse your Report Server and which have all the SQL Server instances in your environment registered as Registered Servers in SSMS. Preferably, this is your central management server where SSRS is installed.
- The script downloads the solution from github for you and unzips the solution in C:\SQL Server Performance Dashboard folder. If you want to unzip and save the solution at a different location, you can modify the $ReportsBaseFolder = 'C:\SQL Server Performance Dashboard' location in the script.
- In the script, the assumption is, you will be deploying the reports on default instance of SSRS on the local server. If you have named instance of SSRS or SSRS server is located on a different server, you need to modify report server url $SSRSInstance = 'https://localhost/ReportServer' appropriately before running the script.
- The script automatically deploys the Setup.sql script to all SQL Server instances registered in Registered Servers in SSMS.
Thanks to Aaron, the deployment of SQL Server Performance Dashboard is now smooth and easy and doesn’t require installation or knowledge of SSRS deployment. Aaron’s PowerShell script is integrated in Tiger toobox github repository for customers and SQL community. If you wish to improvise or add or contribute to the solution, feel free to send a pull request in GitHub for the solution.
All the reports use Windows authentication to connect to the target SQL Server instance so if browsing user is part of a different domain or do not have login or VIEW SERVER STATE permissions, the reports will generate an error. Further, this solution relies on Kerberos authentication as it involves double hop (client -> SSRS server -> target SQL instance), so it is important that target SQL Server instances have SPNs registered. The alternative to Kerberos authentication is to use stored credentials in the report which helps bypass double hop but is considered less secure.
If you have also deployed the SQL Performance Baselining solution and System Health Session Reports from Tiger toobox github repository, you can use the same central SSRS server for hosting all the reports and running it against target SQL Server instances as shown below. The SQL Performance Baselining solution can be useful to identify the historical resource consumption, usage and capacity planning while SQL performance dashboard reports and System health session reports can be used for monitoring and point in time troubleshooting.
Parikshit Savjani
Senior Program Manager (@talktosavjani)
Comments
- Anonymous
January 11, 2017
Parik, great job bring these reports to the world. Its what MS SQL needed. We still use them everyday. - Anonymous
January 20, 2017
It crashes SQL Studio 2016 + SP1 every time I open the dashboard report. It's on a brand new Dell server with Windows Server 2016 freshly installed. There must be a compatibility problem with the Performance Dashboard. :-(- Anonymous
January 20, 2017
Hi Gary, Do you mean SSMS crashes when you open dashboard report. If SSMS crashes, have you tried the solution in GitHub and deployed your reports in SSRS. If you mean reports in SSRS crashes, have you applied the hotfix KB 3207512. - Anonymous
March 04, 2017
There were some missing references in previous versions of SSMS, now it works with the latest version (16.5.3 as of now) All reports are working again ;)
- Anonymous
- Anonymous
February 07, 2017
I get an authentication error. I can only see the reports for the local server (sql server where the SSRS is installed)deployed reports to a SSRS 2014 server.all servers are in the same domain.allthough I'm logged in to the reportserver, when typing in any server but the local one, at [view report] the error says"An error has occurred during report processing. (rsProcessingAborted)Cannot create a connection to data source 'DataSource1'. (rsErrorOpeningConnection)Login failed for user 'NT AUTHORITY\ANONYMOUS LOGON'."- Anonymous
February 07, 2017
Hi Klaas,This error refers to Kerberos configuration issue on our remote SQL Server instances. You have two options to handle it1. Register SPNs for your remote SQL Servers. You can use Kerberos configuration manager to identify missing spns.2. Alternatively, you can configure stored credentials by modifying ssrs reports which can bypass the double hop scenario.- Anonymous
February 13, 2017
I'm getting the same DataSource1 error from the main page as well. SPNs are in place, so this isn't this issue. What else can be tried?An error has occurred during report processing. (rsProcessingAborted)Cannot create a connection to data source 'DataSource1'. (rsErrorOpeningConnection)I can see that your DataSource1 is configured to use the server name directly as input (="Data Source=" & Parameters!Server.Value & ";Initial Catalog=msdb"). How is CMS involved in this, if it all? Is this something that needs to be still configured in the package? The only server that works for me currently is the server where the package is deployed and CMS is configured.- Anonymous
February 13, 2017
Ok, one thing to note that I figured out is if you are running a non default port, you do have to add that to your server name so that it can connect on that port. Note the report works fine if I navigate to the reports URL on the reporting server, but I still can't connect from the reports URL remotely.- Anonymous
February 13, 2017
Yes, you are correct. If sql server is listening on non default port, you will need to provide non default port in the connection string. This is similar to you connecting to sql instance using ssms and bypassing sql browser service.
- Anonymous
- Anonymous
February 13, 2017
This is completely unrelated to CMS. Your SSRS server might be installed on the CMS which avoids double hop scenario. If your target server is named instance, you might spns for SQL browser service. Additionally the windows account should be marked as not sensitive and support for Kerberos delegation in Active directory. Lastly, if your AD security uses Kerberos constrained configuration, the SPNs of the target sql server instance needs to be registered in AD. To workaround this Kerberos issue and isolate the issue, you can use stored credentials in the report and see if report runs with store credentials
- Anonymous
- Anonymous
March 01, 2017
Sorry,still not working.The accounts I used are not marked as sensitive and are sa on both the Report server and the target sql servers.SPN's are created too.yet, with integrated security, I get:An error has occurred during report processing. (rsProcessingAborted)Cannot create a connection to data source 'DataSource1'. (rsErrorOpeningConnection)Login failed for user 'NT AUTHORITY\ANONYMOUS LOGON'.and with stored credentials for an account with all possible privileges (domain admin and sa), I get:An error has occurred during report processing. (rsProcessingAborted)Cannot create a connection to data source 'DataSource1'. (rsErrorOpeningConnection)Login failed for user 'MYDOMAIN\MyDomAdm'.- Anonymous
March 05, 2017
To isolate the issue, from the server where your SSRS server is hosted, you will have to create a simple UDL file and try to connect to the target SQL Server and see if connection to SQL Server works.- Anonymous
March 08, 2017
Yes, that works perfect.I can connect to all servers involved.Also, other reports are getting data from those servers with integrated security and the same user.Point is that 'Windows integrated security' is checked, and yet 'NT AUTHORITY\ANONYMOUS LOGON' is returned.With [Test Connection], I get:The value of parameter 'DataSource' is not valid. (rsInvalidParameter)- Anonymous
April 19, 2017
Klaas, If you are seeing ANONYMOUS LOGON error, there is definitely an issue with Kerberos setup. I would encourage you to run Kerberos Configuration Manager against that SQL Server instance to identify missing or misconfigured SPNshttps://blogs.msdn.microsoft.com/sqlreleaseservices/released-microsoft-kerberos-configuration-manager-for-sql-server-v3-1/- Anonymous
May 11, 2017
Hi Parikshit,I was having the exact same issue. I'd set the credentials in all the reports and deployed them from Data Tools but but when I tried to run them on SSRS Web Portal got same error as Klaas. Strangely enough, even though I updated the credentials in every report in Data Tools and then re-deployed the whole solution when I opened a subreport which was failing in Report Builder the data-source was still showing as Windows Auth (integrated security).To resolve this issue I had to go into every report in Data Tools and change the name of the data-source from DataSource1. As soon as I renamed it in a sub-report and re-deployed then I could access it fine from the dashboard.
- Anonymous
- Anonymous
- Anonymous
- Anonymous
- Anonymous
- Anonymous
- Anonymous
February 09, 2017
After deploying performance_dashboard_main report and accessing report "By CPU” I got below errors did I missed any part. I even tried all the reports but getting same error i executed setup_sql scripts also.Did i missed anythingError messege - The item '/SQL Performance Baselining Reports/traces' cannot be found. (rsItemNotFound)- Anonymous
February 09, 2017
Hi prasad, Have you deployed all the reports and are trying to access the report from performance_dashboard_main hyperlinks?
- Anonymous
- Anonymous
February 16, 2017
Is there a way to install it without installing Visual Studio?Can I deploy all the rdls manually?What should be changed and where?- Anonymous
February 27, 2017
Yes, you can upload the rdl files manually using Report Manager. Alternatively, you can use the PowerShell script in GitHub repository by Aaron to auto deploy the rdls https://github.com/Microsoft/tigertoolbox/tree/master/SQL-performance-dashboard-reports
- Anonymous
- Anonymous
March 15, 2017
Hi FolksFirst of all, thank you for your efforts.I'd like to get quite a bit more detail about setting up the remote connections. Like:1. All of the non-central servers, what is the process to setup connections if they are all running under Active Directory?2. All of the non-central servers, what is the process to setup connections if they are all running under some thing other than Active Directory?I understand (now) after looking terms up (SPN - https://msdn.microsoft.com/en-us/library/cc281382.aspx; UDL - https://msdn.microsoft.com/en-us/library/ee276360(v=bts.10).aspx, etc.), but there needs to be a defined triage/setup process (better than what I have here), otherwise I'll be sitting around another day, thinking I've wasted my time.- Anonymous
March 15, 2017
Rob,This is no different then any SSRS report trying to query target SQL Server instance. The SSRS reports in SQL Performance Dashboards are configured to use Windows Authentication by default which means, any user browsing the reports against any SQL Server instance, must be a valid Windows Login on the non-central servers and should be authenticated by AD. If the users browsing the report is not a valid login on the target non-central SQL Server instances or if user belong to a different domain or AD or if SPN issues prevent the user getting authenticated from AD, you will get an error and one way to overcome the error is to modify the reports to use stored credential (https://msdn.microsoft.com/en-us/library/ms159736.aspx) in Data source which is a valid login (SQL Or Windows) against target SQL Server instance. This will ensure any user who has permissions to browse the report (permissions can be controlled from SSRS Report Manager) will be able to browser the reports since internally reports will use the stored credential to query the target SQL Server instance. Hope this clarifies !!!- Anonymous
March 15, 2017
Hi ParikshitSo I have AD access to the other 3 non-central servers already.Do I need to setup database connections anywhere in SSRS? (It's been 10 years since I used SSRS and the interface for doing this isn't the same.) I run just fine locally :)ThanksRob- Anonymous
March 15, 2017
If you have AD access and if you are the user browsing the report, you wont need to setup database connections, the default settings will work for you.Regards,Parikshit- Anonymous
March 16, 2017
Hi ParikshitSome comments:1. I have AD access access to 3+ satellite SQL Servers (w/o having SSRS involvement and all is fine)2. I have no problem running the local http: "ReportViewer.aspx?%2fSQL+Server+Performance+Dashboard%2fperformance_dashboard_main&rs:Command=Render"3. I took at look in the SQL Server 2016 Reporting Services Configuration Manager, Database, Current Report Server Database and it is set for "Native" and I can test against connecting to each of the 3+ satellite databases successfully. But there isn't anything intelligible about what you'd want to do:a.) there are no satellite databases running SSRS (which is what the interface is searching for)b.) I need ALL the databases on the satellite SQL Servers, but again the interface is offing me only 1 database from the dropdownNon of these pieces, nor links seem to make much sense (in context). Are you and MS employee and would you be willing to Skype?Rob- Anonymous
March 16, 2017
and enabling remote errors ( on 2016 ) doesn't exist ( as described here: https://msdn.microsoft.com/en-us/library/aa337165.aspx#bkmk_script )- Anonymous
March 22, 2017
Taking it offline with Rob
- Anonymous
- Anonymous
- Anonymous
- Anonymous
- Anonymous
- Anonymous
- Anonymous
March 22, 2017
Hi Parik,I deployed your reports successfully. Some of them run , and some of them throw an error message saying The 'version_string' parameter is missing a value. would you have nay idea where this missing value could be.- Anonymous
March 22, 2017
Hi Lakshmi,You should always start with SQL Performance Dashboard report which you can think as a landing page or a master report and click on the links from Performance dashboard report to navigate to other reports. The Performance dashboard report has hyperlinks to all the other reports. Regards,Parikshit- Anonymous
March 22, 2017
Parik,What is the logic behind that ? I tried it that way and yes all the linked reports works,but on the landing page if I do click on the individual reports which have more detailed info , for eg: wait_latch those reports fail.- Anonymous
March 22, 2017
Lakshmi - These are parameterized reports and the parameters are supplied from the SQL Performance Dashboard report. Further when you are troubleshooting using you will always start with dashboard reports and navigate to other reports and go back & forth.There is another set of reports called as Performance Baselining reports which you leverage as well for historical trending of data from Tiger GitHub repositoryhttps://github.com/Microsoft/tigertoolbox/tree/master/SQL-Performance-Baseline
- Anonymous
- Anonymous
- Anonymous
- Anonymous
April 19, 2017
What changes needs to be made to display CPU usage for last 24 hours in the report?.- Anonymous
April 19, 2017
Surjit,No changes are required. If you have setup the database and SQL Agent jobs correctly which captures the CPU usage, you should start seeing in the report. If there are any technical issue or errors you are hitting let me know. For technical issues, i would suggest you open a technical issue in GitHub repo so I can track it.- Anonymous
April 26, 2017
After deploying the reports, I get the ‘version_string’ parameter is missing a value error. would you have nay idea where this missing value could be.How do I go about fixing this error?
- Anonymous
- Anonymous
- Anonymous
April 26, 2017
After deploying the reports, I get the ‘version_string’ parameter is missing a value error. would you have nay idea where this missing value could be.How do I go about fixing this error?- Anonymous
May 19, 2017
Hi Spencer. All the subreports need to be run via the main dashboard report. The parameter for the SQL Server Version will be populated from within the main dashboard report.
- Anonymous
- Anonymous
May 19, 2017
Hi Parikshit. Would it not improve performance of all stored procedures in MS_PerfDashboard schema in MSDB if SET NOCOUNT ON was added to each one? - Anonymous
May 23, 2017
The comment has been removed - Anonymous
June 09, 2017
Hello,Great scripts but cannot seem to get any data showing in Daily Performance Trend whereas all the others seems to be working, at least I think they are.Am using SQL 2016 so wondering if there are any known issues that may be at play here.- Anonymous
June 09, 2017
There are no known issues and the reports should work in SQL Server 2016 as well. Is the jobs running successfully? Are the performance data populated in the views.- Anonymous
December 08, 2017
The comment has been removed- Anonymous
December 08, 2017
Hi Meipoon,Can you open an issue on GitHub for that ?- Anonymous
December 08, 2017
I installed SQL server Data tools 2015 this afternoon, and marked targetserverversion to "SQL Server 2008 R2, 2012 or 2014", then I was able to successfully redeploy XEventReporting. Now I am able to view all the XEventReports I just deployed. Thanks for checking with me.--Mei
- Anonymous
- Anonymous
- Anonymous
- Anonymous
- Anonymous
January 31, 2018
There are 6 reports I don't know how to reach from the: Performance Dashboard Main -Page Details-Plan Guide-Wait Blocking (Blocking Report)- Wait Buffer IO (Buffer IO Waits Report)-Wait Buflatch (Buffer Latch Waits Report)-Wait Latch (Generic Latch Waits)Can someone advise ?(the other 15 I do manage to reach) - Anonymous
February 23, 2018
After deployment ran setup file also in my test instance.After that i given server name and clicked view report.Got below error:The 'version_string' parameter is missing a valueCould you please help me out