Troubleshooting SQL Server High CPU usage using Xperf
Xperf/WPA is a powerful Windows tracing tool that can be used to assist in troubleshooting numerous issues on a Windows server. The utility allows for in depth tracing without the high overhead typically associated with such tracing. This is accomplished by making use of the Event Tracing for Windows architecture (ETW). ETW is built into Windows and most other MS products. This allows for the tracing of both the user mode and kernel mode activity on a server. This provides an end to end look at the processes being traced. While most troubleshooting for sql server will be done with the normal toolset (profiler, xevents, perfmon, dmvs), there are a number of issues where xperf can fill in the gaps. Notoriously difficult issues such as stalled or long IOs and high privileged time are prime candidates for xperf and its ability to hook into the kernel.
Kernel Tracing
While xperf has the ability to trace both kernel and application providers, I won't go into the app side in this post as SQL Server has its own ETW tool in Xevents. In the past, trying to get insight into what is happening at the kernel level has been extremely difficult. Generally, a debugger and possibly a crash dump were required to gain information of what was happening at the kernel level. Xperf allows for quick and easy inspection of kernel events without the need for a debugger.
Caution
While ETW is light weight, as with any tracing there is too much of a good thing. In general, xperf tracing on the target server will only have a couple percent CPU overhead, however, the more kernel flags and providers added to the trace the impact will grow. The other big consideration for running xperf is where the log file is and do you have the space. Xperf traces tend to be large and can grow to multi-GB in times as little as 10 minutes. You will want to ensure the trace files are written to a different drive than the sql databases to mitigate the impact of log generation on the performance of your system. As with any tracing, if possible test your commands in lower environments before moving to production.
Where do I get Xperf? Xperf is included as a part of the Windows SDK under the Windows Performance Toolkit:
https://msdn.microsoft.com/en-us/windows/hardware/hh852363.aspx
The SDK has many components but if you are just interested in the Xperf piece, you can select just the Windows Performance Toolkit as a part of the download:
Basic Syntax
Before getting into any samples let's look at the basic syntax for getting a kernel trace with xperf.
To start a trace:
Xperf -on <kernel flags> -stackwalk <kernel flags>
To stop a trace:
Xperf -d <path to save the output to>
To view a trace:
You can still use the xperfview.exe, however, this is being deprecated in favor of using WPA.exe. The WPA.exe is included in the Windows Performance Tools download.
This is a very small subset of the commands for xperf. For more syntax info see: https://msdn.microsoft.com/en-us/library/windows/desktop/hh162920.aspx
Two useful commands to know are:
Xperf -providers KF
--will dump all the available kernel flags
And
Xperf -providers KG
--will dump all the available kernel groups
While you can specify a list of kernel flags to capture, you can also substitute a kernel group which is merely a collection of kernel flags.
For example:
Xperf -on PROC_THREAD+LOADER+DISK_IO+HARD_FAULTS+DPC+INTERRUPT+CSWITCH+PROFILE
is equivalent to:
Xperf -on Latency
Stackwalk
The -stackwalk flag is where xperf gets a lot of its power. With stackwalk enabled for the necessary kernel flags, the xperf output will be able to show you stack information for the executing processes. With this you can see what functions are being called and thus more directly where CPU activity or CPU Waits are occurring.
One issue with capturing stackwalk is that you need to change the DisablePagingExecutive reg key before running xperf with stackwalk. Xperf will check for this setting at startup and warn you if the change is not made. The DisablePagingExecutive reg key controls whether kernel code is paged to disk. If the code is paged we cannot get the stackwalk information. Without the regkey you will be able to get the stack info for all code that is in memory but you may see random stacks not populate correctly. Before running stackwalk it is recommended to change the
HKLM\SYSTEM\CurrentControlSet\Control\Session Manager\Memory Management\DisablePagingExecutive to 1 (https://technet.microsoft.com/en-us/library/cc959492.aspx). Note this does require a reboot to go into effect which may make it difficult to do in production environments.
Troubleshooting Samples
SQL high CPU
In general, for a high cpu scenario where sql server is driving cpu, traditional tools such as profiler, perfmon, and dmv's will be the preferred method of troubleshooting the issue. However, this gives a good example to show the power of xperf and how it could supplement the traditional tools.
For this scenario, I will use the following xperf command:
Xperf -on Latency -stackwalk profile
I created a manufactured scenario to create high cpu on my system using ostress and some pretty nasty queries. I collected xperf for just over one minute. Note you will want to keep xperf traces short as the collections can get large quickly. My one minute trace came out to 200MB. This will vary depending on the number of processes running on a box and which kernel flags you set.
After collecting the trace, I fired up WPA and opened the collected .etl file.
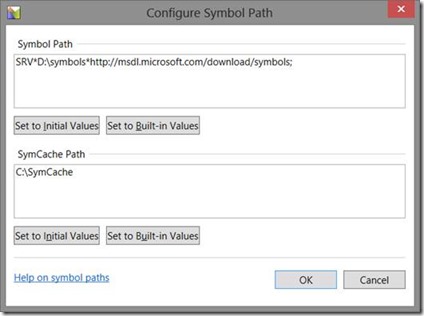
First you will want to make sure you have your symbols lined up. This is important for making the Stackwalk information readable. When xperf collects function and stack information it does not capture the actual function names. Lining up symbols allows xperf to look at the symbols and present back to you the actual function names, as you will see below. If symbols are not set, you will see question marks instead of function names.
For my symbols, I use a local cache of D:\symbols and point to the Microsoft public symbol server,
https://msdl.microsoft.com/download/symbols.
You can set an environment variable of _NT_SYMBOL_PATH equal to your path so that this is populated by default and you don't have to retype this each time.
Once the paths are set, you can then in the Trace drop down menu select "Load Symbols". At this point symbols will either be found in your local cache or downloaded from the symbols site. Depending on your network connectivity, this could take a few minutes.
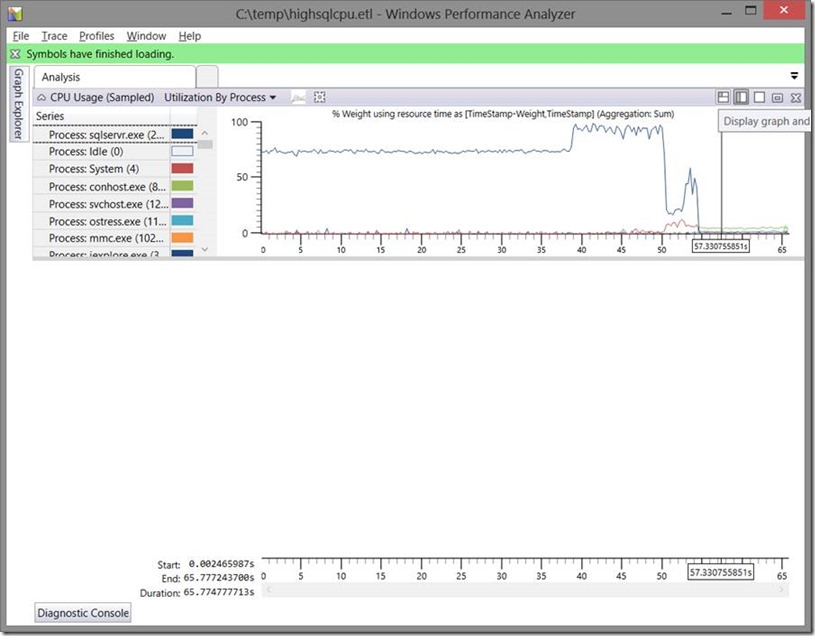
On the left we can now open the Graph Explorer and see all the possible graphs we can look at. There are many charts that breakdown the data in different ways which can be useful for different scenarios. In this case since we have a known application, I will look at the "Utilization by Process". You drag the chart from the Graph Explorer into the main window.
As we can see there is one process consuming the majority of the cpu. By simply hovering over the high line on the cpu chart we will see which process that line represents.
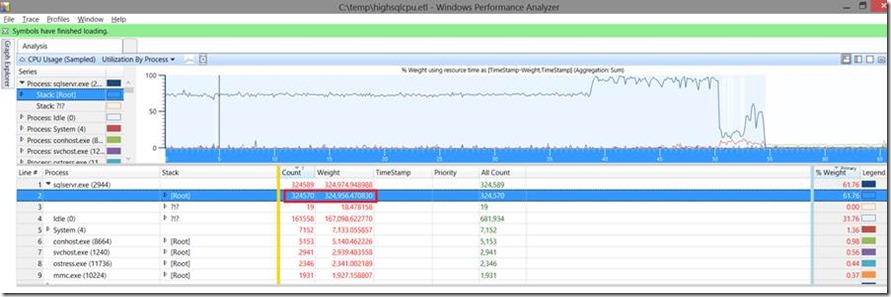
As expected we see SQL Server consuming the majority of the cpu. To get more information about what SQL was doing we need to open the details table. We open this by clicking on the "Display Graph and Chart" icon.
Once the detail table is open, we will need to add the stack column to get more information:
Now we can see the stack information for the processes. With this we can follow the Weight column to see which process stack is using the CPU:
We will drill down and follow the weight to fully expand the stack that was using the most cpu.
As we drill down we see the weight start to split up at different function. We are most interested in seeing the high level of where most the work was being done. The Weight stays the same up to the point where we hit the FnProducerOpen function in sql server. Without knowing the source, we can guess here that Parallel queries use the idea of producers and consumers. Seeing as the stack is generating producers we can surmise the cpu is being eaten by parallel queries. Looking a little further down we still see a large chunk of the CPU being used by the BuildSortTable function. Again, this gives us information that we are dealing with Sort tables. At this point we would definitely need to use this information along with profiler or sys.dm_exec_requests/sys.dm_exec_query_stats to see which queries may be running in parallel and possibly have ORDER BY clauses.
As it happens, just by looking at some dvms with the following query:
select r.session_id, t.task_address, st.* from sys.dm_exec_requests r inner join sys.dm_exec_connections c on r.session_id = c.session_id
inner join sys.dm_os_tasks t on r.session_id = t.session_id
cross apply sys.dm_exec_sql_text(c.most_recent_sql_handle) st
order by r.session_id
I could see a large number of parallel queries all executing the following statement:
select distinct ts.dbid, tb.HashID, tbb.HashID from ReadTrace.tblUniqueStatements tb cross join ReadTrace.tblStatements ts cross join ReadTrace.tblBatches tbb
order by ts.DBID, tb.HashID, tbb.HashID
So I now have a pretty good place to start investigating as the above query was parallel and is doing an order by.
Again this was a bit of a manufactured scenario to demonstrate how we can use xperf. In the future posts we will cover scenarios more suitable for xperf such as looking at privileged time and long IO's.
Joe McTaggart – Premier Field Engineer
Comments
Anonymous
June 30, 2013
extremely interesting, thx!Anonymous
October 07, 2014
" At this point we would definitely need to use this information along with profiler or sys.dm_exec_requests/sys.dm_exec_query_stats " Noooo! what we want to see here is integration between WPR and Xevents, and correlate in the WPA GUI !Anonymous
July 17, 2017
Magnificent site. Plenty of helpful info here. I¡¦m sending it to a few friends ans also sharing in delicious. And certainly, thank you to your sweat!imitation cartier bijoux homme http://www.toplevejewelry.com.ru/Anonymous
December 26, 2017
The comment has been removed


