[Guest Post] IntelliTrace Tips and Tricks: The Basics–Part 1–Colin Dembovsky
This two-part series of blog posts will show you how to get the most out of IntelliTrace – a historical debugger that allows you to record (and replay) program execution. A third post on some advanced IntelliTrace tips is already posted here .
Using IntelliTrace
You can use IntelliTrace in the following scenarios:
1. During debugging in VS using F5
2. In Test Manager (enabled as a Data Diagnostic Adapter)
3. Anywhere (using the standalone collector)
Understanding IntelliTrace “Modes”
Out of the box, IntelliTrace has 2 broad modes – “Events Only” and “Events and Call Information”. Events Only is much more lightweight, and allows you to record “events” that occur when your program is running. These “events” are “interesting occurrences” – like ASP.NET calls or ADO.NET calls – or exceptions. The product team tried to record events which would help you understand how your code works so that you can understand long “cause and effect” chains.
Events and Call Information turns the dial up a lot – it collects not only all of the events from the Events Only mode, but also method calls (including in and out arguments). There are some limits placed on what data is collected – otherwise the logs would become even more enormous than they are using the default settings.
F5 IntelliTrace
Use this when you’re coding. It means you can debug and move back and forwards in your debug session without having to stop your application and add breakpoints. To turn it on, go to Tools->Options and go to IntelliTrace settings. Here you’ll see the 2 modes:
Once you’ve turned it on (in this case I’ve got the Events and Call Information mode on) you can start debugging. Click around your app, and then click the “Break All” link in VS in the IntelliTrace window:
(Here I am debugging my Calculator application – click “Break All” to go to the IntelliTrace log).
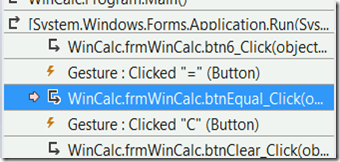
When you look at the log, you’ll initially see all the events that occurred. In this case, button clicks are “Gesture” events, so that’s what I see:
Let’s say that I remember something weird happened when I clicked “=” when multiplying 2 numbers – well, I don’t have to restart the application, I can simply click on the “=” gesture after the “*” button click (in the above log, I’ve clicked 3 x 6 =). So I can click on that event and “rewind” to that point.
What I can now do is click “Calls View” to start walking through the log from that point.
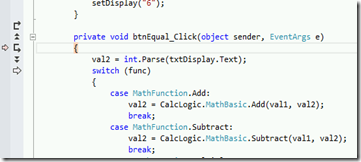
Double-click on the call to btnEqual_Click to “zoom” to that point of the execution. You’ll see the IntelliTrace glyphs in the gutter of the source window:
If you mouse-over the icons, you’ll get a tooltip. The functions (in the order they appear) are:
· return to calling method
· step back
· step into
· step over
· return to Live Debugging
(Just a handy tip: If you press the bottom button “return to Live Debugging” remember that this now puts you at the current debugger point – you’ll need to press F5 again if you want to start running the application again.)
If you advance using F11, the current pointer will advance. Pressing twice from the previous image gets me to the point where the program enters the switch statement:
Notice that I don’t need to guess which case statement was selected – the log records exactly what the program did. I’ve also pinned the mouse-overs for val1 and val2 – you can see their values. Not all values are collected, but since these are primitives and are being passed into (or out of) a method, IntelliTrace dutifully collects their values.
I’ll press F11 again to step into the Multiply() method, and then F11 again to advance one more event:
That puts me onto the closing curly brace of the Multiply method. If I look in the Autos window, I’ll see that the method in parameters (val1 and val2) were 3 and 6 respectively, and that the return value was 9.
Voila – with 3 or 4 clicks we found the bug in our program. And we didn’t even have to set a breakpoint!
Filtering Events
As you use IntelliTrace, you’ll start seeing large amount of events – to make the logs easier to navigate, you can use the category, thread and search box at the top of the events window to filter the events.
For example, expanding the dropdown with “All Categories” in it I can filter just exceptions:
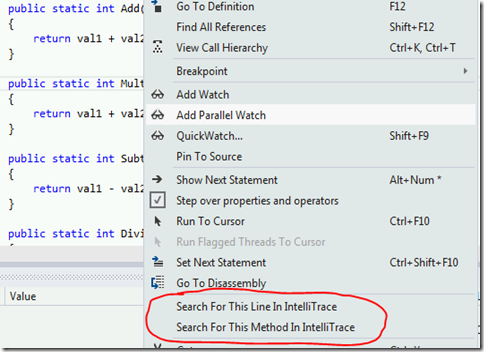
Search For This Line…
Another useful tip is the “Search For this line” or “Search For This Method”. You suspect that a method was hit sometime during your debug session – but the log is quite long. No problem – right click a line (or method) and select “Search For This Line / Method in IntelliTrace”.
Once you do, you’ll see the search results in a bar at the top of the current code window – press the arrows to go to the previous or next instance of that line or method in the log file:
Here I’ll click on the arrow icon directly after the work “Multiply” to go to the first call to this method in the log, and I can start “debugging” from there.
In the next post, I’ll show you how to run IntelliTrace anywhere and everywhere.
Happy debugging!
Comments
Anonymous
May 15, 2013
Great post.. Thanks for such kind of post..! Even screen shots are provided..!Anonymous
May 17, 2013
Screen shots make even easier


