WCF: Debugging WCF Throttling
Behavior:
w3wp process stops responding to the incoming request and recycling app pool fixes the problem.
Data Collection:
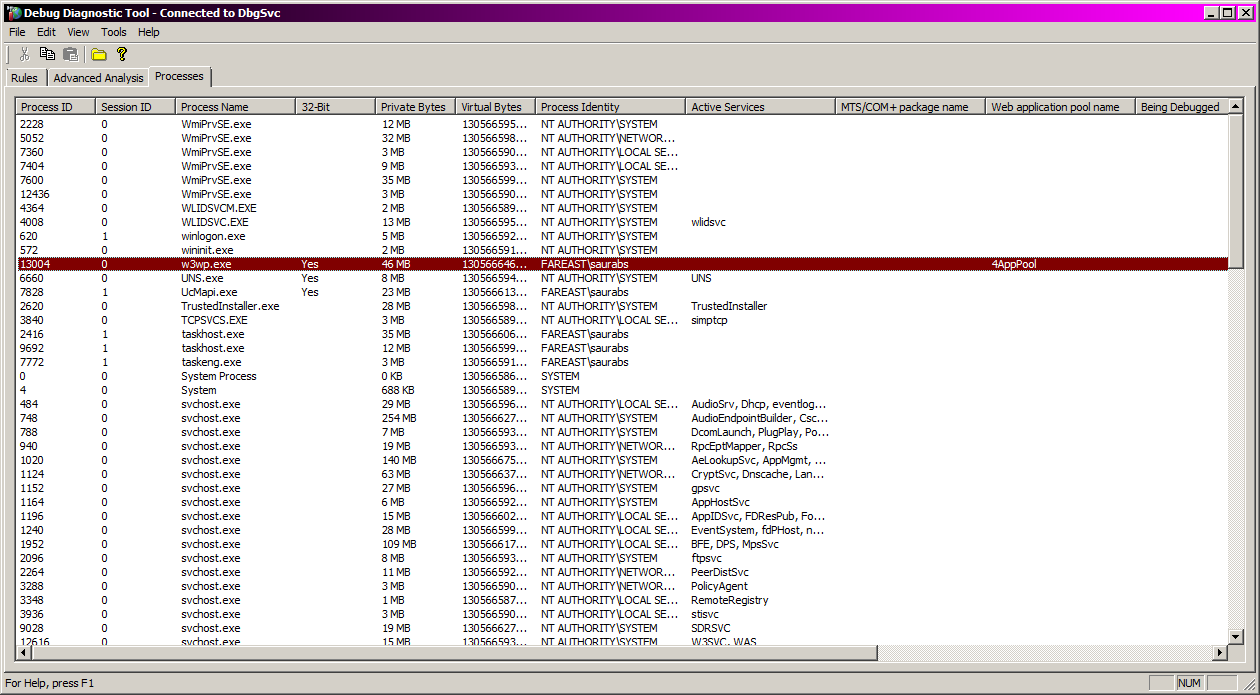
Download and Install DebugDiag from
https://www.microsoft.com/download/en/details.aspx?id=26798
Click cancel.
Go to process tab.
Select the w3wp process and right click and say - create full user dump
Analysis
Let us search the WCF Security context object and observe the throttling values .....
To get there, we need object of service host .....
!dumpheap -stat
0x000007fef6a56a90 1 248 System.ServiceModel.ServiceHost
We got the Method table ...
Now let us get the address .....
0:036> !dumpheap -mt 0x000007fef6a56a90
Using our cache to search the heap.
Address MT Size Gen
0x00000000ff66d358 0x000007fef6a56a90 248 1 System.ServiceModel.ServiceHost
Now we got the object .... let us !do it ...
0:036> !do 0x00000000ff66d358
Name: System.ServiceModel.ServiceHost
MethodTable: 000007fef6a56a90
EEClass: 000007fef6413680
Size: 248(0xf8) bytes
GC Generation: 1
(C:\Windows\assembly\GAC_MSIL\System.ServiceModel\3.0.0.0__b77a5c561934e089\System.ServiceModel.dll)
Fields:
We need to find the service throttle object now .....
Analyzing the Session object ....
Solution
We need to add a Service behavior on server side and increase this value .....
<serviceBehaviors>
<behavior name="Throttled">
<serviceThrottling
maxConcurrentCalls="1"
maxConcurrentSessions="1"
maxConcurrentInstances="1"
/>


