Using Azure Service Bus to Build Pub/Sub Application (Part-2)
I recently added a handful of custom performance counters to monitor Azure Service Bus quality behavior in the Pub/Sub system with Service Bus implementation. I like to share some observations from the data captured in visualization form, because this is a preliminary step for large data set study effort. Some findings may be worth considered as one powerful monitoring strategy, i.e. pattern recognition, or image matching.
Let me introduce some of these counters when I explain several “visualized stories”. My motivation is to share and evangelize the methodology more than the data itself. As Azure invests more in Service Bus technology, some of the exploring work results might become useless, but the thinking and implementation approach will remain invaluable.
Have all published events been sent to Service Bus successfully?
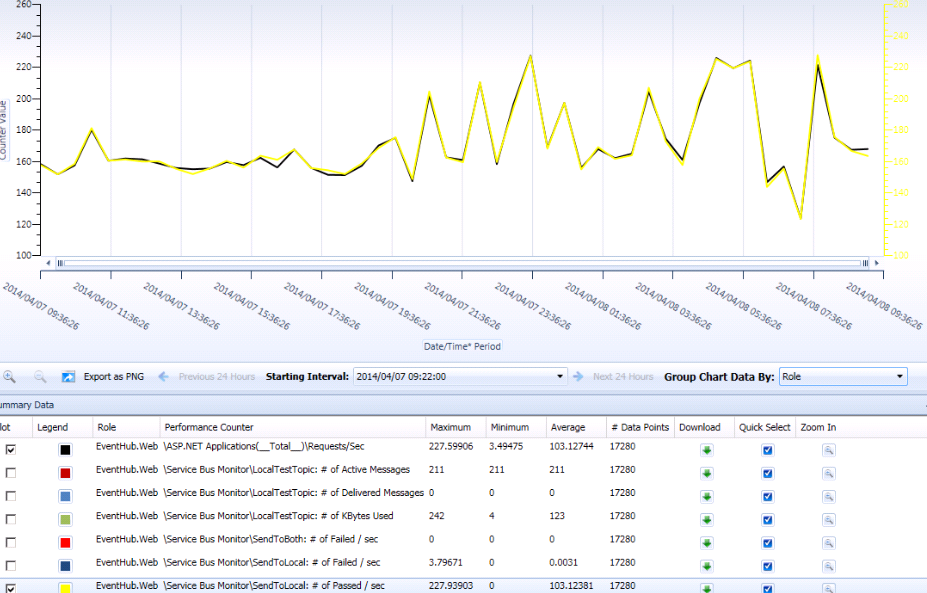
“\Service Bus Monitor\SendToLocal: # of Passed / sec” tracks number of events per second that have been successfully sent to Service Bus.
If we know all the incoming traffic are routed to local data center Service Bus, we should expect to see the chart of this perf counter (in yellow) completely matches to the chart of “\ASP.NET Application(_Total_)Requests/Sec” (in black).
The difference between the two charts is from “ \Service Bus Monitor\SendToLocal: # of Failed / sec”, roughly speaking.
This is an easy way to check, within a given time frame, if there is any (local) Service Bus failure at its ingress interface, and how much impact it has had.
How to track Service Bus failure?
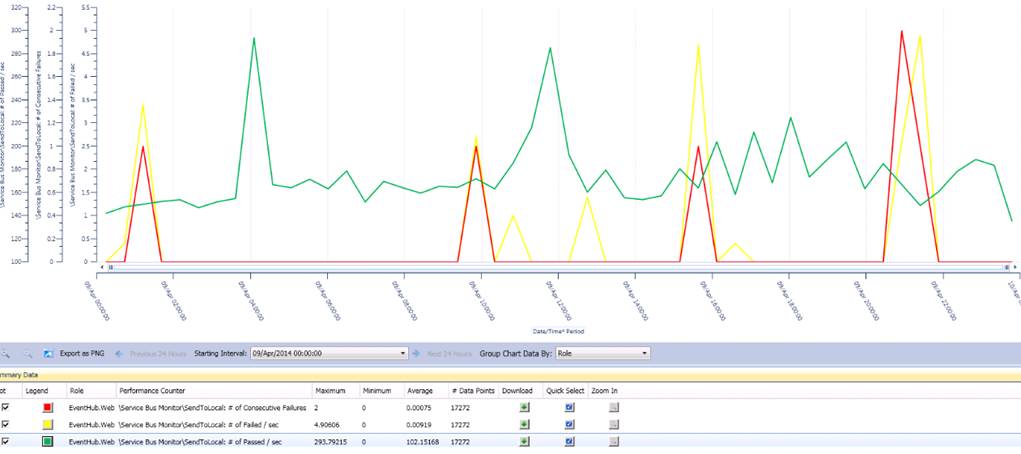
“SendToLocal: # of Failed / sec” logs count of failures and timestamp for local SB instance errors (could be caused by SB internal server busy state). This count should match “SendToRemote: # of Passed / sec”, according to current routing principle. If we see “SendToBoth: # Failed / sec” has more than “0”, it clearly indicates message(s) failed to send to both local and remote SB instances, which tells us the message(s) were lost in transferring to SB cluster. This will be a critical error. We may quickly check these graphs before we drill into event log for error details.
We are capturing “SendToLocal: # of Consecutive Failures” to see how consistently it behaves when the local SB instance fails to respond properly at its ingress. The monitoring results tell us this symptom repeats several times a day, but the failure went away quickly, like “service bus glitch”, I am continuing to track this number (max is ‘2’ by far), and see if it is possible to figure out a reasonable threshold for us to design an algorithm to reroute partial or all traffic under specific condition.
Latency comparison between local and remote data center
We need to design a Geo-distributed messaging system for high performance and low chance of failure. We set up two Service Bus instances
in two data centers.
Is sending data to the SB instance at local data center always better performed than sending it to the remote SB instance? What is latency trend to local/remote look like over time? At which point, we should consider rerouting traffic in the case of SB instance failure? Etc.
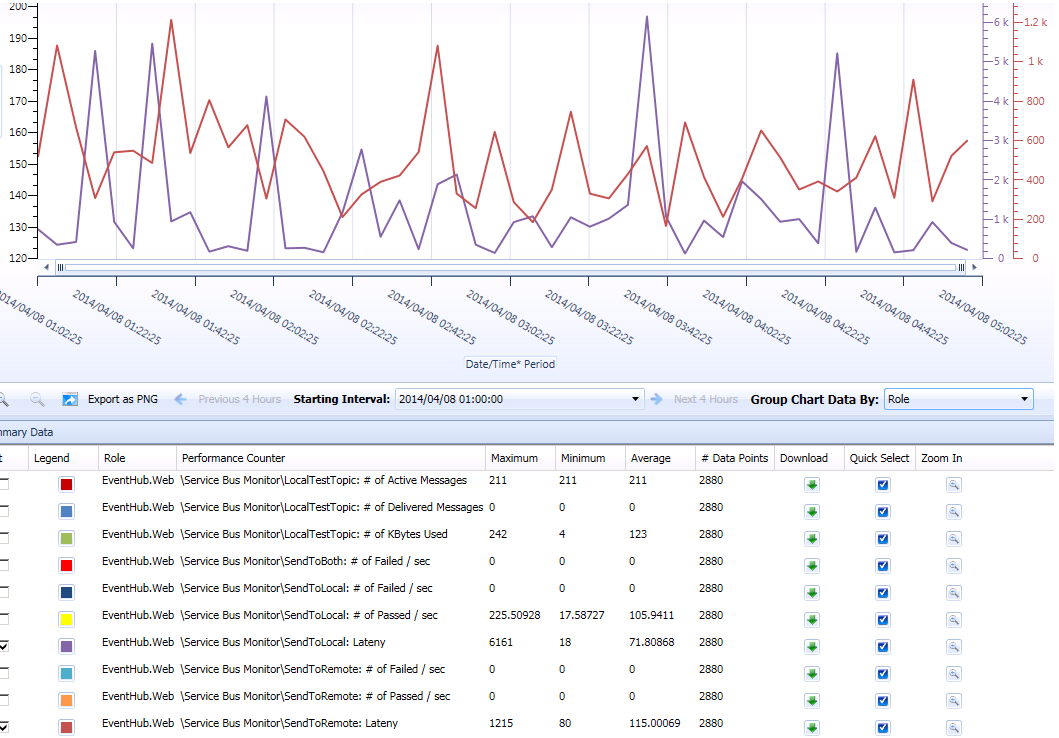
With these questions in mind, I added “SendToLocal: Latency” and “SendToRemote: Latency”. Monitoring threads are instrumented to send test message to the two SB instances frequently and gather their roundtrip time measurement as latency result.
This is one example trending graph. The red line represents Latency (ms) trend to remote SB. The purple line shows Latency (ms) trend to local SB. (The scale is not the same for the two lines from the tool I am using, by the way.)
This is what I have learned so far.
- Most of the time, latency to local is x% of latency to remote. This is what expected considering the basic network latency by geo location difference.
- Quite often, latency to local spiked and significantly “prevailed” latency to remote. This is interesting but “annoying”, as it adds mystery factor to the “black box” (SB). We know the incoming traffic prefers us to always route it to the local SB. We also know at some point of time it likes us to change the route temporarily due to SB internal state change, i.e. low/normal load to over load or short of broker resource.
- Latency increase may be a leading factor for SB connection failure. This is a hypothesis. It follows common sense, but I have not got any concrete proof. The more I look at the data and their comparison, the less confidence I have on this statement. We will need to collect more data, or improve the approach we collect data. But I am sure probability and statistics should play a big role in this study. This is similar as how we are trying to measure, monitor, and “forecast” earthquake today.
Relation between latency and failure of SB
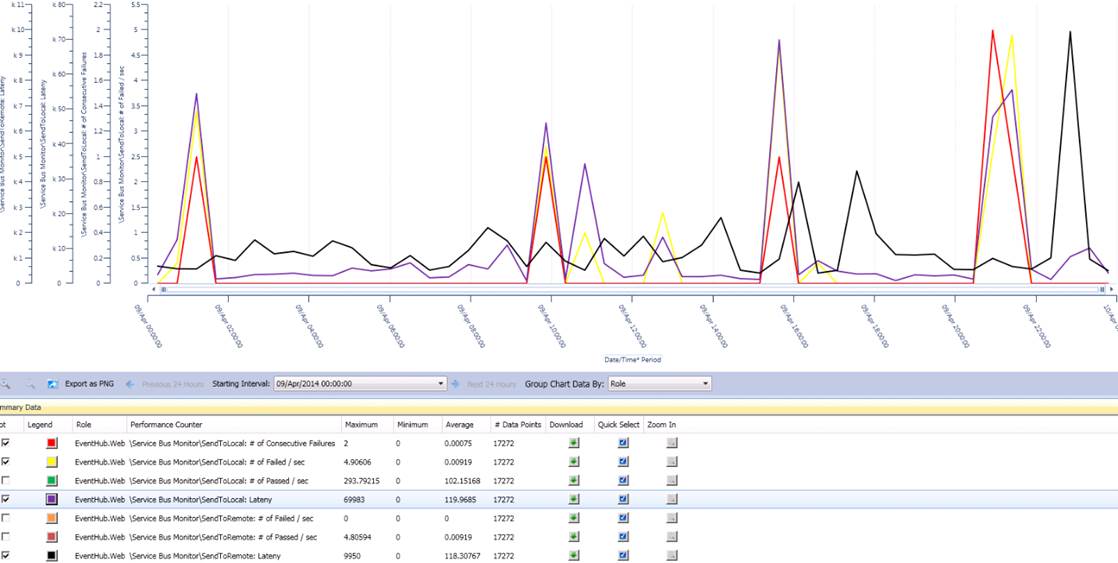
This is an example graph of getting latency counters and failure count trends together. The goal is finding a possible pattern that reveals failure(s) versus latency changes specific to SB instance. This is a continuing data study process. No conclusion to share at this moment.
(End)


