Ingest Azure Diagnostic logging in Log Analytics (OMS) Part 1
It’s a great Friday! The sun is shining here in San Francisco, there’s a food truck festival in town AND you can now get your Azure diagnostic logging into OMS Log Analytics. Superb!
WHY
Let’s say you use Network Security Groups or Azure Application Gateway. You’ve been able to enable diagnostic logging in Azure for a while. We can now ingest that logging into Log Analytics, so you can centrally monitor it and do all those beautiful things like alerting, dashboards or auto-remediation.
What I’ll discuss here is formally documented here, but this is a simple walk-through.
WHAT?
OK, so today, you can ingest diagnostic data into Log Analytics from the following stuff:
- Azure Automation
- Key Vault
- Application Gateway
- Network Security Group
These write JSON formatted log files out to an Azure storage account. That’s what we can get into Log Analytics.
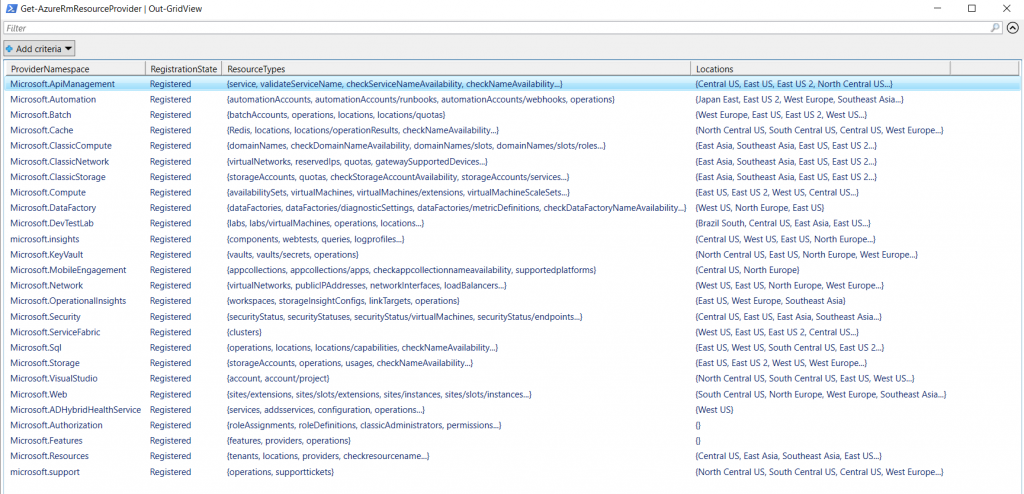
To be formal, let’s take a look at the Azure Resource Types which we can bring into Log Analytics. To check them out you can run this from Azure PowerShell:
Get-AzureRmResourceProvider | Out-GridView
At the time of writing, you can bring the following into Log Analytics:
- Microsoft.Automation/AutomationAccounts
- Microsoft.KeyVault/Vaults
- Microsoft.Network/ApplicationGateways
- Microsoft.Network/NetworkSecurityGroups
If you wanted to see where Application Gateways & NGS are defined, we can just dig into the ProviderNamespace above.
Get-AzureRmResourceProvider -ProviderNamespace Microsoft.Network | Out-GridView
I’ve highlighted the two Resource Types in Microsoft.Network which we support in Log Analytics: 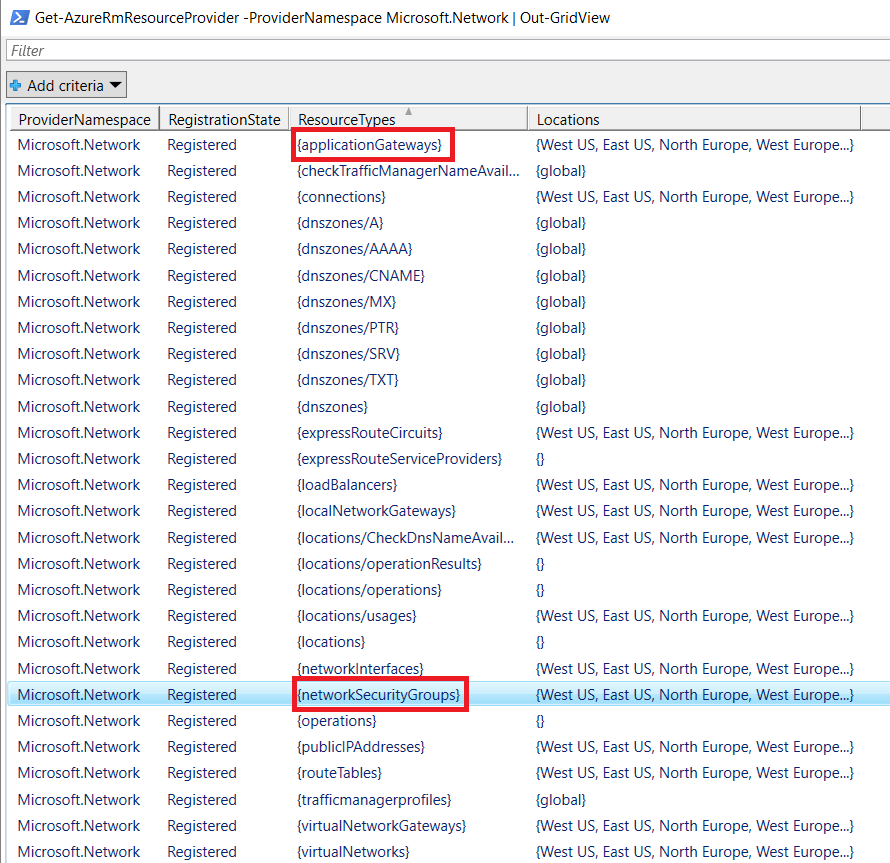
Enabling Diagnostics via the Portal:
OK, so now we know what we can ingest into Log Analytics, how to I enable the diagnostic logging? Well it’s easy, either via PowerShell, or via the Azure Portal.
As an example, I’m going to turn on diagnostic logging for a Network Security Group
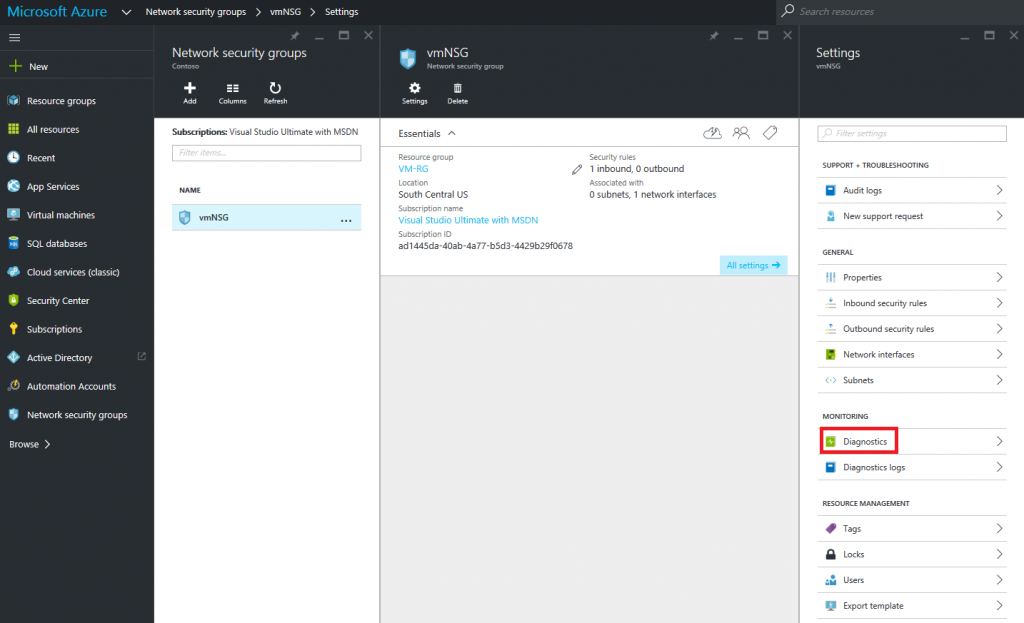
I’ve loaded up the NSG I want to ingest logging from > Settings > Diagnostics:
Next I can simply switch on the diagnostic logging:
- I have to select a storage account to place the logs in. This has to be in the same Azure region as the NSG
- You can see we’ve got 2 separate logs for NSG. Both will be ingested into Log Analytics.
- I’ve set the retention to 1 day. Being as it’ll be in my Log Analytics, I don’t need to keep it longer. However, I could if I needed to 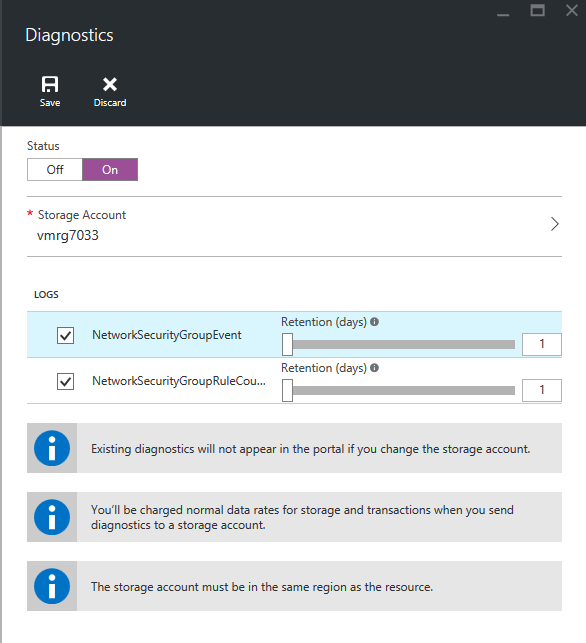
Done! Pretty simple right?!
Enabling diagnostics via PowerShell:
OK so here’s the deal - not all of the resources have the diagnostics tab in the portal. This is NBD anyway. Hey PowerShell is the future, so you should use that anyway :)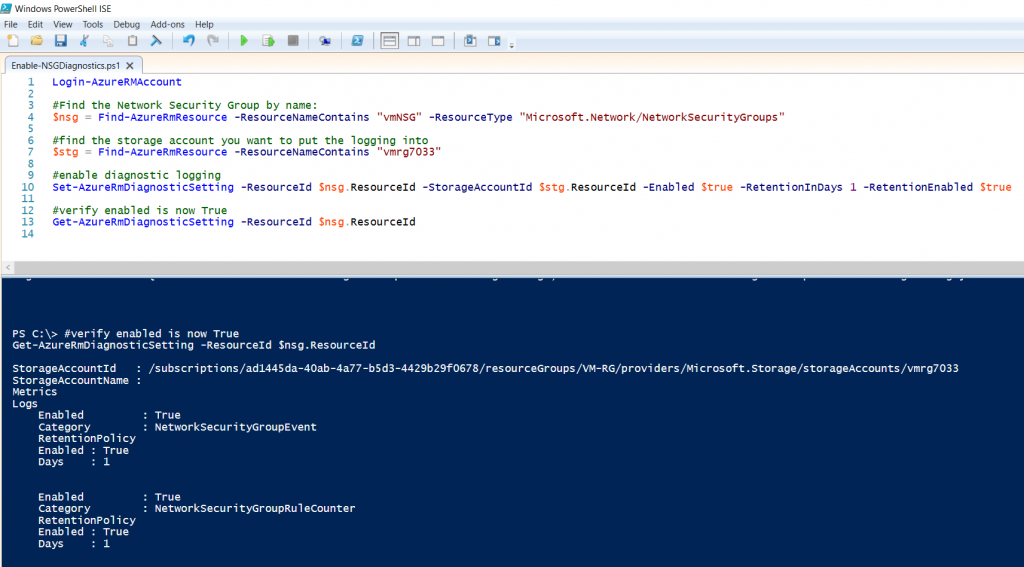
In the example below I’ve enabled diagnostic logging on an NSG named vmNSG. I’m putting the diagnostic logging into a storage account named vmrg7033. This is the same as the portal steps above.
I also set the logging to be retained for a single day.
Notice, the ResourceType is exactly the same as I listed above! So if you wanted to enable diagnostic logging for an Application Gateway, you can simply update this example.
Login-AzureRMAccount
#Find the Network Security Group by name:
$nsg = Find-AzureRmResource -ResourceNameContains "vmNSG" -ResourceType "Microsoft.Network/NetworkSecurityGroups"
#find the storage account you want to put the logging into
$stg = Find-AzureRmResource -ResourceNameContains "vmrg7033"
#enable diagnostic logging
Set-AzureRmDiagnosticSetting -ResourceId $nsg.ResourceId -StorageAccountId $stg.ResourceId -Enabled $true -RetentionInDays 1 -RetentionEnabled $true
#verify enabled is now True
Get-AzureRmDiagnosticSetting -ResourceId $nsg.ResourceId
Now we’ve enable diagnostic logging, let’s have a look at how to get that ingested into Log Analytics – we’ll do that in part 2!
