Using Log Search in Microsoft OMS
At the core of Microsoft Operations Manager Suite (OMS) is the log search feature which allows you to combine and correlate machine data from multiple sources within your environment. Solutions are also powered by log search to bring you metrics pivoted around a particular problem area.
On the Search page, you can create a query, and then when you search, you can filter the results by using facet controls. You can also create advanced queries to transform, filter, and report on your results.
Common log search queries appear on most solution pages. Throughout the OMS console, you can click tiles or drill in to other items to view details about the item by using log search.
Getting Started
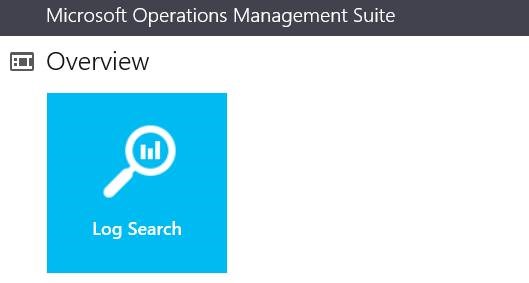
After logging into your portal, in the top left corner of the home screen you will see the Log Search tile. This is at the core of using OMS.
When you click the Log Search tile you are brought to the following screen:
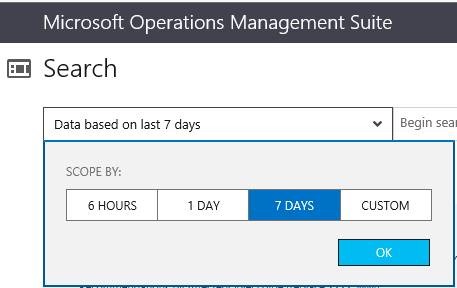
Here you can use the dropdown to choose the time range you want to search. In the example below we’ll choose 7 days:
When typing in your search string, notice that Autocomplete is available. There are currently three categories of Autocomplete that get suggested to users:
1. Available Fields: This is a partial list of what fields are available to search.
For a reference of fields that are available, see the Search field and facet reference section in the following document in the Microsoft TechNet Library:
2. Recent Searches: These are items that you searched for recently. This helps you save time when running similar searches.
3. Saved Searches: These are searches that have been saved as useful. By clicking the Save icon after a search is run, you can add that search to this list. The search page features these saved searches, plus some additional searches that get added with each solution pack.
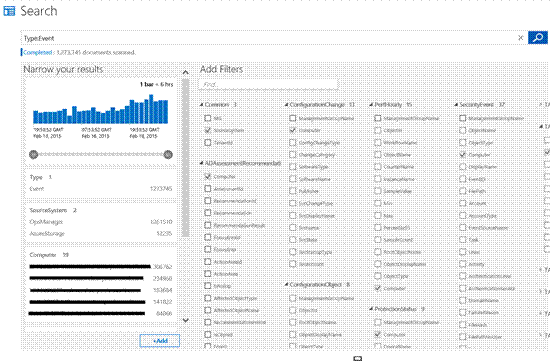
Filtering is available on the left hand side of the search screen. These filters can save a lot of time and effort as when these are selected they add the appropriate syntax to your search string automatically. For example, doing a search on Type=Perf gives the options to narrow it down by Computer, ObjectName, CounterName, InstanceName and CounterPath.
You can also add fields by clicking the +Add button at the lower left hand corner of the search screen to get additional filters that may be of interest, as shown below.
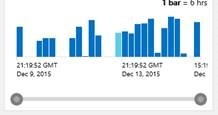
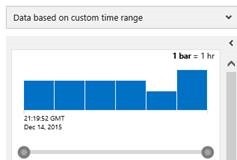
Filtering on time is available by using the time window box in the top left if you want to drill into the data.
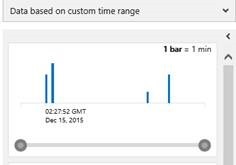
Clicking on the bar will drill into that 6-hour time frame so that you can get a better idea of what occurred during that time frame. You can continue to drill down to see a specific time range:
Going further
The corresponding results will be displayed in the search results on the right pane so that you can see what computer, performance counter or other detail that is applicable to that time frame.
Also, once you complete a search, you can export your results to Excel by clicking the Export button at the bottom of the screen. This will create a .csv file of your results.
Additional automated log searches can be done with the Log Search API. See the following for more information:
Automate log searches with the Log Search API
Additional posts on log search
-
- Azure Operational Insights Search How To: Part I – How to filter big data
- Azure Operational Insights Search How To: Part II – More on Filtering, using Boolean Operators, the Time Dimension, Numbers and Ranges
- Azure Operational Insights Search How To: Part III – Manipulating Results: the pipeline “|” and Search Commands
- Azure Operational Insights Search How To: Part IV – Introducing the MEASURE command
- Azure Operational Insights Search How To: Part V – Max() and Min() Statistical functions with Measure command
- Azure Operational Insights Search How To: Part VI – Measure Avg(), and an exploration of Type=PerfHourly
- Azure Operational Insights Search How To: Part VII – Measure Sum() and Where command
- Operations Management Suite Log Search How To: Part VIII – the IN operator and subsearches
- Operations Management Suite Log Search How To: Part IX – the DISTINCT command
- Using Wire Data in Operations Management Suite Log Search
Examples
NOTE The examples below only work if you have enabled the log collection for the data types being discussed, if you get 0 results from these searched verify that you have enabled that data type and your machines are communicating with your OMS workspace successfully.
To search on IIS logs, type the following command into the search: Type=W3CIISLog. To break this down further you can use the Measure command with different functions.
To search near-real time performance data, type the follow command into search: Type = Perf. This will return all performance counters that are being collected for your environment by OMS.
Note that there are two different types of value returned for this search: Logs and Metrics.
Logs are 30 minute aggregated values of the performance counter. These are stored based on your data plan with OMS. See https://www.microsoft.com/en-us/server-cloud/operations-management-suite/pricing.aspx for details on data plans.
Metrics are the raw results for each of the performance counters configured and are stored for 14 days.
To further filter your performance data, you can also add more parameters to your search to find exactly what machine is affected or other things that may interest you. For example, if you want to return all performance data for a specific computer you can use the following:
Type = Perf Computer=”ComputerName”
If you want to return performance data for the Current Disk Queue Length counter across all servers you can run the following:
Type = Perf CounterName=”Current Disk Queue Length”
You can even combine the examples to give you the Current Disk Queue Length counter for one specific machine:
Type = Perf CounterName=”Current Disk Queue Length” Computer=”ComputerName”
You can even drill further into the performance data by decreasing the time range. For example, if you make your time range small enough (e.g. 6 hours or less), the charts will show you live data.
Additional Information
Adrian Doyle | Senior Supportability PM | Microsoft 

Our Blogs
- Configuration Manager: https://blogs.technet.com/configurationmgr/
- Data Protection Manager: https://blogs.technet.com/dpm/
- Orchestrator: https://blogs.technet.com/b/orchestrator/
- Operations Manager: https://blogs.technet.com/momteam/
- Operations Management Suite: https://blogs.technet.microsoft.com/omsblog/
- Service Manager: https://blogs.technet.com/b/servicemanager
- Virtual Machine Manager: https://blogs.technet.com/scvmm
- Microsoft Intune: https://blogs.technet.microsoft.com/intunesupport/
- WSUS: https://blogs.technet.com/sus/
- AD and Azure RMS: https://blogs.technet.com/b/rms/
- Application Virtualization: https://blogs.technet.com/appv/
- MED-V: https://blogs.technet.com/medv/
- Application Proxy: https://blogs.technet.com/b/applicationproxyblog/
- Forefront Endpoint Protection: https://blogs.technet.com/b/clientsecurity/
- Forefront Identity Manager: https://blogs.msdn.com/b/ms-identity-support/
- Forefront TMG: https://blogs.technet.com/b/isablog/
- Forefront UAG: https://blogs.technet.com/b/edgeaccessblog/
