Analyzing C++ AMP Code with the Concurrency Visualizer
In this entry, I will describe the features in the Concurrency Visualizer that provide visibility into C++ AMP code. As an example, I’ll run a simple C++ AMP reduction sample under the Concurrency Visualizer. The implementation doesn’t aim to have the best performance; instead, it serves the purpose of allowing us to walk through the process of understanding the execution behavior of C++ AMP code through the Concurrency Visualizer lens.
The following code finds the sum of elements in a vector, which is one variant of a reduction. This implementation uses a parallel_for_each invocation to schedule the work on the accelerator (in this case, a DirectX 11 GPU). Within the parallel_for_each, a for-loop is used to accomplish something reminiscent of recursive-doubling, a technique used to compute a prefix sum in parallel. Note how the vector is passed to the constructor of a concurrency::array, which at that point will synchronously copy the data to the default accelerator.
  1: template <int _tile_size>
  2: float reduction3(const vector<float>& source)
  3: {
  4:     int element_count = source.size();
  5:     auto a = array<float, 1>(element_count, source.begin());
  6:     array_view<float, 1> av(a);
  7:
  8:     while (element_count >= _tile_size)
  9:     {
  10:         extent<1> e(element_count);
  11:         assert((element_count % _tile_size) == 0);
  12:
  13:         parallel_for_each(e.tile<_tile_size>(), [=, &a] (tiled_index<_tile_size> tidx) restrict(amp)
  14:         {
  15:             int tid = tidx.local[0];
  16:             tile_static float tile_data[_tile_size];
  17:             tile_data[tid] = a[tidx.global[0]];
  18:             tidx.barrier.wait();
  19:
  20:             for(int s = 1; s < _tile_size; s *= 2)
  21:             {
  22:                 if (tid % (2*s) == 0)
  23:                 {
  24:                     tile_data[tid] += tile_data[tid + s];
  25:                 }
  26:
  27:                 tidx.barrier.wait();
  28:             }
  29:
  30:             if (tid == 0)
  31:             {
  32:                 a[tidx.global[0]] = tile_data[0];
  33:             }
  34:         });
  35:
  36:         compact_elements<_tile_size>(a, element_count / _tile_size);
  37:
  38:         element_count /= _tile_size;
  39:     }
  40:
  41:     std::vector<float> result(element_count);
  42:     copy(av.section(0, element_count), result.begin());
  43:     return std::accumulate(result.begin(), result.begin() + element_count, .0f);
  44: }
Given a _tile_size of 512 and an element_count equal to 16*1024*1024, the outer while-loop executes twice. Therefore, there are two parallel_for_each invocations. In addition, within the outer while-loop, a call to compact_elements is made, whose implementation also involves the use of a parallel_for_each:
  1: template <int _tile_size>
  2: void compact_elements(array<float, 1>& data_in, int element_count)
  3: {
  4:     // Using temporary array to avoid race condition
  5:     array<float, 1> result(element_count);
  6:     extent<1> e(element_count);
  7:     parallel_for_each(e, [=, &data_in, &result] (index<1> idx) restrict(amp)
  8:     {
  9:         result[idx[0]] = data_in[idx[0] * _tile_size];
  10:     });
  11:     // Update data for next iteration
  12:     copy(result, data_in);
  13: }
In all, reduction3 schedules a total of four parallel_for_each invocations.
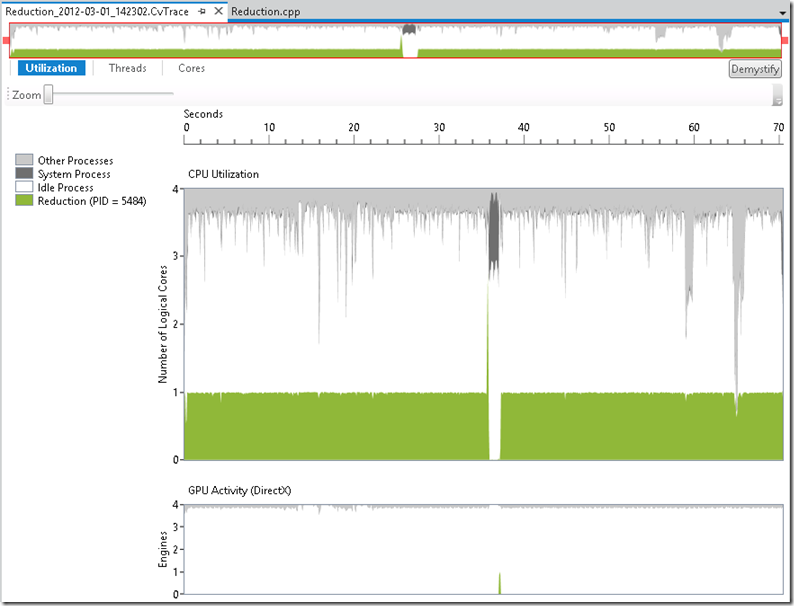
After verifying the correctness of this algorithm, I now want to examine its execution behavior. Therefore, I run this under the Concurrency Visualizer (in Visual Studio 11 Beta) and I first see the following view:
The initial Utilization View depicts the degree of CPU utilization in the upper chart and the presence/absence of GPU activity in the lower chart. Based on this data, I can see that roughly one CPU core was in use by my Reduction application throughout execution. The lower chart depicts GPU activity in terms of the quantity of DirectX Engines active at any point in time. Keep in mind that a DirectX Engine is a special-purpose execution unit on the GPU. For example there is typically a 3D engine, a video engine, etc. The quantity and type of engines varies depending on your hardware. The type of engine that needs to be used depends on your algorithm. In this particular case, DirectX uses the paging and compute engines to transfer data (between CPU and GPU) and to perform the computation respectively.
In the Utilization View, I can see the short region of time between 36 and 38 seconds where my code executed on the GPU. This is shown by the short burst of GPU activity depicted in the GPU Activity chart. As expected, the CPU appears idle at this time, as my code has no useful work to do while it waits for the GPU to finish.
My next step is to switch the Threads View (using the button at the top-left), zoom in on this short region of GPU activity, hide some uninteresting threads, and look at things in more detail:
The timeline in this view contains a number of swim lanes. The top lane shows the state of the Main Thread throughout the execution of the Reduction app. The next lane below shows descriptive events generated by the C++ AMP runtime. The glyphs that represent these activities are referred to as Markers. As an aside, you can generate Markers from your own code using the Concurrency Visualizer SDK. The last two lanes show activity for each DirectX Engine on my system. Specifically, each segment in these swim lanes represents the duration in which a DMA packet was being processed by a specific engine. DMA is the mechanism by which work is submitted to the GPU. These segments are color-coded based on whether they were scheduled on behalf of the process being profiled, other processes, or whether they represent paging (i.e. memory transfer between the CPU and GPU).
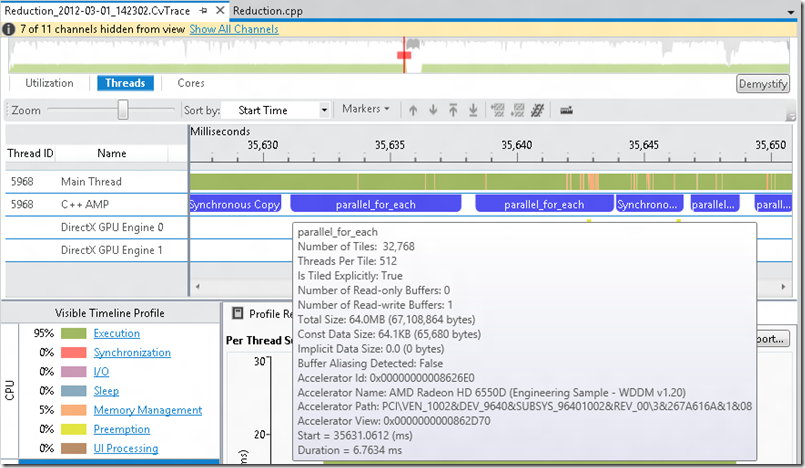
Ignoring the DirectX engine activity for a moment, I want to examine the C++ AMP markers a bit further. In the screenshot above, I can see two synchronous copy Markers on either side of several Markers that are too close together to see. I can zoom into the region between the synchronous copy Markers to see that there are four parallel_for_each Markers and a single synchronous copy Marker. After hovering over the left-most parallel_for_each Marker, I get the following picture:
I can see a synchronous copy (representing the concurrency::array construction), followed by two parallel_for_each Markers, a synchronous copy Marker (which occurs as a result of the call to compact_elements), and two additional parallel_for_each Markers. The left-most synchronous copy Marker above shows that data transfer was scheduled before the parallel_for_each invocations were scheduled. As expected, I see four parallel_for_each Markers, representing the four parallel_for_each invocations executed by my algorithm. Note that these Markers are generated by the CPU, so they don’t represent the exact point in time when the work happened on the GPU. Rather, they represent when the work was submitted to the GPU. This is why we see a delay between the Markers and when the DirectX engines became active.
The screenshot above also shows the tooltip when I hover over the first parallel_for_each Marker. The tooltip provides data about the Marker itself (e.g. start time and duration) and information about the parallel_for_each invocation.
After zooming out, I can now see a clearer picture of the relationship between the parallel_for_each invocations being scheduled and the work actually occurring on the GPU:
First of all, there is a frequent occurrence of DMA packets being processed on behalf of other processes throughout my app’s execution. This is shown as frequent, small yellow segments in the lower two lanes. I’m less interested in these because they likely represent work being done on behalf of other processes. What’s more interesting to me is the DMA processing on behalf of my application (green segments). This gives me a precise picture of the way my workload was processed on the GPU. Specifically, I can see that this work didn’t occur on the GPU until sometime after it was scheduled by the CPU. This is evident based on the fact that the parallel_for_each Markers (starting around 35,631 ms) shown two screenshots above occur well before the DMA segments, which indicate execution on the GPU (occurring between 37,000 ms and 37,200 ms), as seen in the screenshot above.
By selecting one of the DMA segments, I can get further information under the “Current” tab (shown in the screenshot above). Here, I can see information about the context handle and the length of time required to process the DMA packet. I can see the same information for any other DMA segment I select.
Now, let me improve upon the original code a bit and profile it again. Here is an improved version of the reduction code that minimizes branch divergence:
  1: template <int _tile_size>
  2: float reduction4(const vector<float>& source)
  3: {
  4:     int element_count = source.size();
  5:     array<float, 1> a = array<float, 1>(element_count, source.begin());
  6:     array_view<float, 1> av(a);
  7:
  8:     while (element_count >= _tile_size)
  9:     {
  10:         extent<1> e(element_count);
  11:         assert((element_count % _tile_size) == 0);
  12:
  13:         parallel_for_each(e.tile<_tile_size>(), [=, &a] (tiled_index<_tile_size> tidx) restrict(amp)
  14:         {
  15:             int tid = tidx.local[0];
  16:             tile_static float tile_data[_tile_size];
  17:             tile_data[tid] = a[tidx.global[0]];
  18:             tidx.barrier.wait();
  19:
  20:             for(int s = 1; s < _tile_size; s *= 2)
  21:             {
  22:                 int index = 2 * s * tid;
  23:                 if (index < _tile_size)
  24:                 {
  25:                     tile_data[index] += tile_data[index + s];
  26:                 }
  27:
  28:                 tidx.barrier.wait();
  29:             }
  30:
  31:             if (tid == 0)
  32:             {
  33:                 a[tidx.global[0]] = tile_data[0];
  34:             }
  35:         });
  36:
  37:         compact_elements<_tile_size>(a, element_count / _tile_size);
  38:
  39:         element_count /= _tile_size;
  40:     }
  41:
  42:     std::vector<float> data(element_count);
  43:     copy(av.section(0, element_count), data.begin());
  44:     return std::accumulate(data.begin(), data.begin() + element_count, .0f);
  45: }
The key differences here are lines in 22 and 23. I don’t want to focus too much on the performance improvement itself in this entry, but by adding this logic, we ensure that all of threads in the same warp (i.e, the scheduling unit on the GPU, which is a team of threads) follow the same path of the branch (on line 23). For all threads in a given warp, the if-statement evaluates to the same value. This avoids branch divergence, which is a big problem for code that runs on the GPU. In branch divergence, threads within the same warp take different paths in a branch. When this occurs, threads that take the first path execute while the other threads stall and vice versa.
After running this implementation under the Concurrency Visualizer, zooming into the appropriate region in the Threads View, and hiding several threads, I see a similar pattern as before. I can use the measure button to verify that this entire process took about 1570 ms (compared to the 1757 ms that the original implementation took):
Another way to compare the performance of the implementations is by adding up the processing duration of the relevant DMA packets. In this case, I can simply select each of the large green DMA segments, get the processing duration from the lower pane, and add up their respective processing durations. I can also hover over each and get the processing duration from the tooltip.
It may be hard to see from the screenshot, but there are actually two large green DMA segments above (as opposed to a single, larger segment). The tooltips for each large GPU access for this process reveal that the processing durations were 14.9 ms and 110.5 ms respectively, totaling 125.4 ms. When I perform the same calculation on the original implementation, the total is 188.6 ms.
Using the Concurrency Visualizer, I can get a better sense of my C++ AMP application’s execution behavior on DirectX. In particular, the Utilization View provides a high level picture regarding bursts of GPU activity. The Threads View illustrates the detailed sequence of CPU and GPU activity via thread and DirectX Engine swim lanes. In addition, Markers that describe the C++ AMP runtime activities provide another source of data to help me make sense of my application’s behavior. With the data provided by the Concurrency Visualizer in Visual Studio 11 Beta, you should now have more insight into how your C++ AMP application maps to the lower-level DirectX layer.
Comments
- Anonymous
August 24, 2013
ok


