How to monitor and troubleshoot the use of Nonpaged pool memory in Exchange Server 2003 or in Exchange 2000 Server
This article is a high level overview on how to troubleshoot current Nonpaged pool memory usage on an Exchange server. It explains what could be done to help mitigate some of the underlying problems that may be consuming Nonpaged pool memory and demonstrates tools that can be used to help track down processes or drivers consuming the most amount of memory.
Nonpaged pool memory is a limited resource on 32-bit architecture systems. It is dependent on how the server is setup to manage memory and is calculated at system startup. The amount of nonpaged pool allocated on a given server is a combination of overall memory, running/loaded drivers and if the /3GB switch has been added to the boot.ini file.
Nonpaged pool memory is used for objects that cannot be paged out to disk and have to remain in memory as long as they are allocated. Examples of such objects may be network card drivers, video drivers and Antivirus filter level drivers. By default, without the /3GB switch, the OS will allocate 256MB of RAM on a server for a Nonpaged pool. When the /3GB switch is added and the server is rebooted, this essentially halves the amount of Nonpaged pool memory on a given server to 128MB of RAM. The Windows Performance team has a table listed in https://blogs.technet.com/askperf/archive/2007/03/07/memory-management-understanding-pool-resources.aspx that discusses what the max pool memory resources can be on any given server. This link also disusses how to view the maximum amount of pool memory on any given server using Process Explorer. For Exchange servers, it is recommended to add the /3GB switch to the boot.ini file with the exception of pure HUB or Front End (FE) servers to allocate more memory to the user processes. As you can see, this limits how much you can load within that memory space. If this memory has been exhausted, the server will start becoming unstable and may become inaccessible. Unfortunately, since this memory cannot be paged in and out, you cannot resolve this problem without rebooting the server.
On Microsoft Windows 2003 64-bit operating systems, the Kernel Nonpaged pool memory can use as much as 128GB depending on configuration and RAM. This essentially overcomes this limitation. See 294418 for a list of differences in memory architectures between 32-bit and 64-bit versions of windows. Currently, the only version of Exchange that is supported on a 64-bit operating system is Exchange 2007, so when working with previous versions of Exchange we may still run into this Nonpaged pool limitation.
Symptoms
When Nonpaged pool memory has been depleted or is nearing the maximum on an Exchange Server, the following functionality may be affected because these features require access to HTTP/HTTPS to function:
1.
Users connecting via Outlook Web Access may experience “Page cannot be displayed” errors.
The issue occurs when nonpaged pool memory is no longer sufficient on the server to process new requests. More information on troubleshooting this issue is available in the following KB article:
Error message when you try to view a Web page that is hosted on IIS 6.0: "Page cannot be displayed"
https://support.microsoft.com/?id=933844
**Note:** If this resolves your OWA issue, it is recommended to determine what is consuming nonpaged pool memory on the server. See the <span class="underline">Troubleshooting</span> section of this document for help in determining what is consuming this memory.
RPC over HTTP connections are slow or unavailable.
If you experience difficulties when you use an Outlook client computer to connect to a front-end server that is running Exchange Server 2003 it can indicate a depletion of Nonpaged pool memory. HTTP.sys stops accepting new connections when the available nonpaged pool memory drops under 20MB. More information on troubleshooting this issue is available in the following KB article:You experience difficulties when you use an Outlook client computer to connect to a front-end server that is running Exchange Server 2003
https://support.microsoft.com/?id=924047The IsAlive check fails on Cluster The cluster IsAlive checks for the Exchange HTTP resource on a cluster server may fail causing service outages or failovers. This is the most common scenario that we see for Exchange 2003 clusters. When there is less than 20MB of nonpaged pool memory, http.sys will start rejecting connections affecting the IsAlive check.
When nonpaged pool is becoming exhausted, the IsAlive check fails causing the resource to fail. Depending on your recovery settings for the HTTP resource in Cluster Administrator, we will try to either restart the resource or fail over the group. By default, we will try restarting the resource 3 times before affecting the group. If this threshold is hit, the entire group will fail over to another cluster node.
To verify if nonpaged pool has been depleted, you can look in 2 possible locations. One is the cluster.log file and the other is the httperr.logCluster.log For the cluster.log file, you may see an entry similar to the following:
00000f48.00000654::2007/05/16-17:16:52.435 ERR Microsoft Exchange DAV Server Instance <Exchange HTTP Virtual Server Instance 101 (EXVSNAME)>: [EXRES] DwCheckProtocolBanner: failed in receive. Error 10054.
Error 10054 is equivalent to WSAECONNRESET which is http.sys rejecting the connection.
Httperr.log In the httperr.log that is located in the %windir%\system32\logfiles\httperr directory on the Exchange Server, you may see entries similar to the following.
2007-05-16 16:44:56 - - - - - - - - - 1_Connections_Refused -
2007-05-16 16:50:42 - - - - - - - - - 3_Connections_Refused -
2007-05-16 16:50:47 - - - - - - - - - 2_Connections_Refused -
2007-05-16 17:16:35 - - - - - - - - - 5_Connections_Refused –This confirms that http.sys is rejecting the connection to the server. Additional information regarding this logging can be found in the following article:
Error logging in HTTP API
https://support.microsoft.com/?id=820729Additional information for this issue is available in the following KB:
Users receive a "The page cannot be displayed" error message, and "Connections_refused" entries are logged in the Httperr.log file on a server that is running Windows Server 2003, Exchange 2003, and IIS 6.0
https://support.microsoft.com/?id=934878
Random Server Lockups or Hangs
Certain operations failing because of the lack of memory to support new operations.
Check the Application and System logs where common operations might be failing.
Potential Workaround to provide immediate/temporary relief
If immediate relief is needed for all these scenarios to prevent these rejections from occurring on a cluster server, then you can add the EnableAggressiveMemoryUsage registry key on the server for temporary relief. When this is added, http.sys will then start rejecting connections when there is less than 8MB of Nonpaged pool memory available, overriding the 20MB default value. See 934878 for more information on setting this key. Note: Please use this as a temporary method to get the Exchange cluster resources back online and investigate the underlying cause of who is taking up the most amount of Nonpaged pool memory on the server. An ideal situation would be having 100MB or less of overall Nonpaged pool memory consumed on any given server.
Nonpaged Pool Memory Depletion events
When pool memory has been depleted, you may start receiving the following error in the System Event log stating that a specific pool memory has been depleted.
Event ID 2019
Event Type: Error
Event Source: Srv
Event Category: None
Event ID: 2019
Description:
The server was unable to allocate from the system NonPaged pool because the pool was empty.
If you are getting these events, then the server is most likely very unstable currently or will be very soon. Immediate action is required to bring the server back online to a fully functional state such as moving the cluster resources to another node or rebooting the server that has this problem.
Troubleshooting
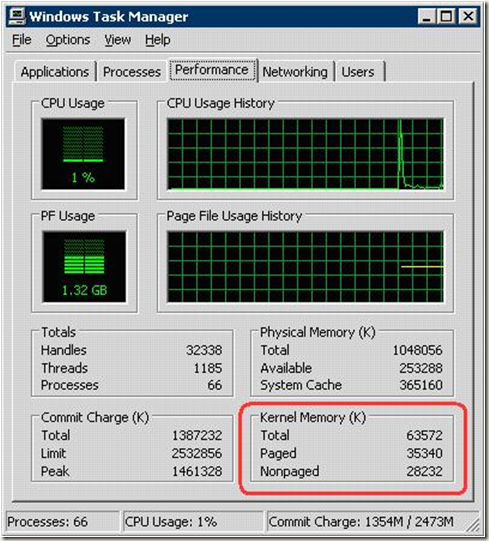
There are a couple of different ways to view the amount of real-time pool memory usage that is currently being consumed and the easiest one is Task Manager. Once you pull up Task Manager, you will need to click the Performance tab and in the lower right hand corner, you will see the amount of pool memory usage that is highlighted. If nonpaged pool is 106MB or more, then there is a possibility that the cluster IsAlive checks for the HTTP resource are failing or close to failing.
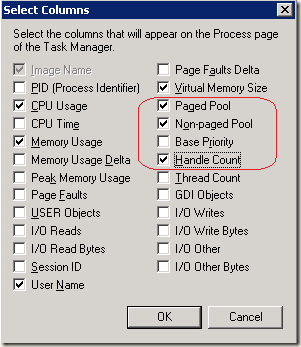
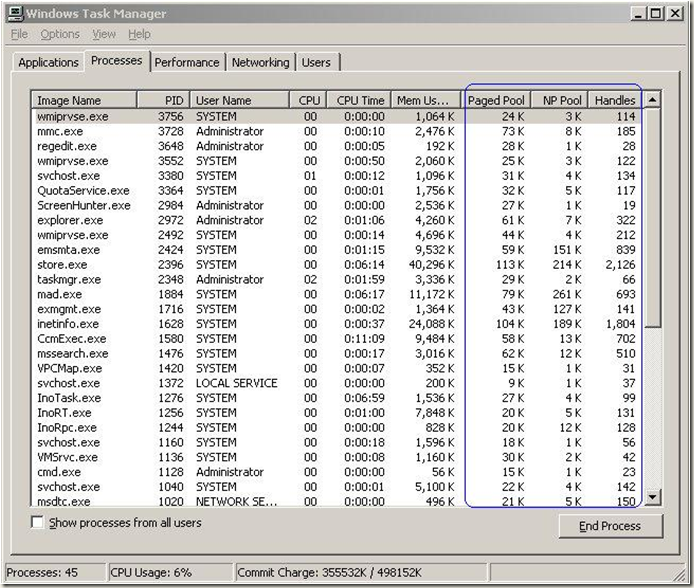
You can also view Nonpaged and Paged Pool usage per process on the Processes tab in Task Manager. I’ve added the Paged Pool column since the same basic rules applies there too. To do this, select the Processes tab, select View on the menu, and then Select Columns. Add Non-paged Pool, Paged Pool, and the Handles columns as shown below.
Once this column is added, you can now view pool usage per process which may help you track down what process is consuming the most amount of memory. You can sort each column to look for the highest consumer. The handle column is added to help determine if there is any process that may have a large amount of handles consuming a larger amount of nonpaged pool memory. (Note: A high handle count may affect either paged or nonpaged pool memory, so keep this in mind when analyzing data.)
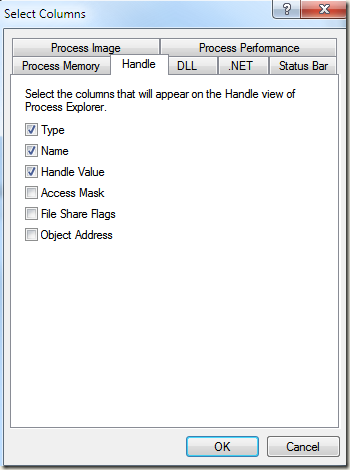
Another way of looking at handles for any given process is to use Process Explorer available here. To add the handle count column, you would select View on the menu, then “Select Columns”, click the Process Performance tab, and then put a check box next to “Handle Count”. Click OK.
If you can’t determine from there what is consuming the memory, this may be a kernel related problem and not application specific. This will require some additional tools to determine what could be affecting the nonpaged pool memory.
One of the first things to look for is drivers that are more than 2 years old that may have had some issues in the past, but have been resolved with later driver releases. Running the Exchange Best Practices analyzer tool (ExBPA) located here can help report any drivers that may be outdated or have been known to have issues previously. If ExBPA did not report any problems with the configuration of the server or any driver related problems, further troubleshooting is necessary.
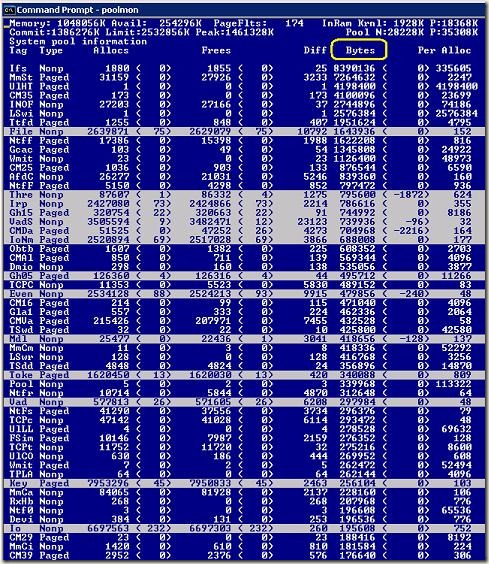
If the Windows Support tools are installed, you can use a tool called Poolmon to allow you to view what specific tags are consuming memory. More information regarding Poolmon can be found in the Windows Support Tools documentation here. To run Poolmon, simply open up a command prompt and type “Poolmon” and then hit the “b” key to sort on the overall byte usage (Bytes) with the highest being at the top. Anything you see that is highlighted means that there was a change in memory for that specific tag.
In this view, you want to look at the top five consumers of memory which should be listed at the top. For the most part, you will be looking at the first two columns named Tag & Type. The Tag is specific to a particular driver and the Type column indicates what type of memory is being used, nonpaged pool (Nonp) or paged pool (Paged) memory. You will also be looking at the Bytes (shown in yellow) column. This column shows the bytes in use for the particular process Tag.
The Allocs and Frees columns can be used to determine if a tag is leaking memory. If there is a large difference between these two columns for a particular tag, then there may be a leak in that particular tag and should be investigated.
The file Pooltag.txt lists the pool tags used for pool allocations by kernel-mode components and drivers supplied with Windows, the associated file or component (if known), and the name of the component.
Where to get Pooltag.txt?
After install the debugging tools for windows located here, pooltag.txt can be found in the C:\Program Files\Debugging Tools for Windows\triage directory and normally has the most recent list of pooltags.
Pooltag.txt can also be obtained from the Windows Resource Kit:
If the specific tag in question is not listed in pooltag.txt and is leaking memory, you can search for pool tags used by third-party drivers using the steps in the following article:
How to find pool tags that are used by third-party drivers
https://support.microsoft.com/default.aspx?scid=kb;EN-US;298102
Once you find what tag pertains to a specific driver, you would contact the vendor of that driver to see if they should have an updated version that may help alleviate this memory leak issue.
Recommended remediation
- Install the recommended hotfixes for Windows 2003 server based clusters from 895092
- Run the Exchange Best Practices Analyzer (ExBPA) tool to ensure that the exchange server is configured optimally. (ie: SystemPages registry setting, any outdated network card drivers, video drivers or storage drivers (storport.sys or SAN drivers), Mount point drivers (mountmgr.sys), boot.ini settings, etc.)
- Ensure that Windows 2003 SP2 is installed. If SP2 is not installed, at a minimum, you need to apply the hotfix in 918976
- Ensure that the Scalable Networking Pack features have been disabled. See https://msexchangeteam.com/archive/2007/07/18/446400.aspx for more information on how this can affect Exchange Servers
- Upgrade ExIFS.sys to the version listed in 946799
- If using MPIO, ensure 923801 at a minimum is installed. 935561 is recommended. Also see 961640 for another known memory leak issue
- If Emulex drivers are installed, be sure to upgrade to the version listed here to help with nonpaged pool memory consumption.
- Disable any unused NICs to lower overall NPP memory consumption
- Update network card drivers to the latest version.
-
- If Jumbo Frames are being used, be sure to set this back to the default setting or lower the overall frame size to help reduce NPP memory usage.
- If Broadcom Drivers are being utilized and are using the Virtual Bus Device (VBD) drivers, be sure to update the drivers to a driver version later than 4.x. Check your OEM manufacturers website for updated versions or go to the Broadcom download page here to check on their latest driver versions.
- Any changes to the Network Card receive buffers or Receive Descriptors from the default could increase overall NPP memory. Set them back to the default settings if at all possible. This can be seen in poolmon with an increase in MmCm pool allocations.
-
- Update video card drivers to the latest version. If any accelerated graphics drivers are enabled, go ahead and uninstall these drivers and switch the display driver to Standard VGA. Add the /basevideo switch to the boot.ini file and reboot the server.
- Check to see if the EnableDynamicBacklog setting is being used on the server which can consume additional nonpaged pool memory. See 951162.
If you are still having problems with NonPaged pool memory at this point, then I would recommend calling Microsoft Customer Support for further assistance with this problem.
Additional Reading
Nonpaged Pool is over the warning threshold (ExBPA Rule)
https://technet.microsoft.com/en-us/library/aa996269(EXCHG.80).aspx
Understanding Pool Consumption and Event ID: 2020 or 2019
https://blogs.msdn.com/ntdebugging/archive/2006/12/18/Understanding-Pool-Consumption-and-Event-ID_3A00_--2020-or-2019.aspx
3GB switch
https://blogs.technet.com/askperf/archive/2007/03/23/memory-management-demystifying-3gb.aspx
Comments
Anonymous
September 16, 2010
Very interesting Article about the usage of poolmon for Debugging. It contains a lot of details I was looking for. Thanks a lot for that. Do you know, by chance, if it is possible to show paged on non-paged memory usage per Process in ProcExp as well ? I was very surprised, that the standard TaskMgr is able to show that while ProcExp seems not be able to do that. But perhaps I'm missing sth.Anonymous
October 10, 2010
Interesting article detailing the page pool consumption on Exchange severs. ThanksAnonymous
November 04, 2014
To see Non Paged Pool Limit in ProcExp - you need to install the symbol files.
