Basic DAX filtering with CALCULATE and ALL functions
Recently I helped a few reporters get their first taste of building reports using Power BI. Power BI provides sophisticated filters and expressions that help you get the most of your data. In this post I'll focus a little on the expressions you can use to create custom calculations in Power BI. The expressions are defined in a language called DAX. Learning to use DAX is not hard, but can be overwhelming for the first timer. I'm hoping to show you in this blog post a few basics to help you get started with DAX measures.
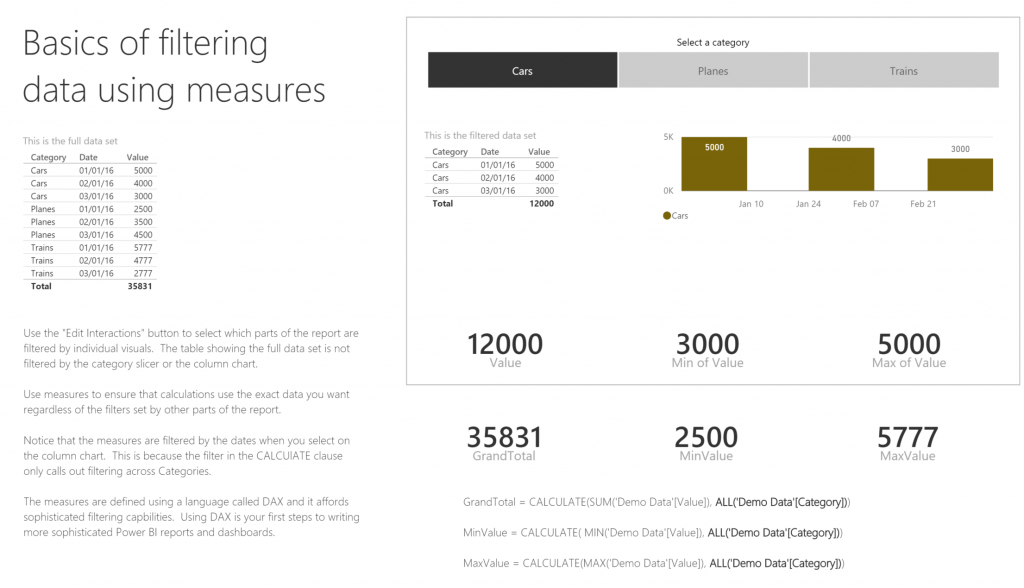
Let's start with an example report. Click through to see the interactive version.
The data in this example is pretty basic, consisting of a single table with to categorical fields and one value field. As you interact with the report, notice that some parts for the report cross filter/highlight (usually this is called 'brushing' by the visualization community). Other parts don't change. Power BI let you control this using two core features.
The first feature is called Edit Visual Interactions. This lets you choose which visuals filter other visuals. I'm using it in this example so the slicer and the column chart do not filter the table on the left. This is easy to do using the option in the ribbon.
The second feature is called Measures. Measures are expressions that calculate values on the fly. Measures are specified using DAX, an Excel like formula language. DAX lets you customize your calculations by selecting exactly which rows of data are included in the calculation.
Let's work through how the "SUM" of "Value" is calculated by Power BI. At first it's pretty simple - you just add all the instance values in the table of data. So SUM of the 9 rows in the example is 35831. When a user selects a category like "Cars", the table of data is filtered to show only the 3 rows and gives a total of 12000.
This makes sense and is pretty easy to do. Now sometimes you want to compare a filtered value to the overall total. So how can you get the unfiltered value while still allowing the user to select various data points within the report. This is where DAX measures come in.
Here's one of the example measures:
GrandTotal = CALCULATE(SUM('Demo Data'[Value]), ALL('Demo Data'[Category]))
In the example I'm using a DAX function called CALCULATE to create three measures. The CALCULATE function takes an aggregate function and a filter context. The aggregate functions I'm using in the example are SUM, MIN, and MAX. I specify which field I want to aggregate, specifically the 'Value' column. This is clear and easy.
The filter context is a little harder to understand. The filter expression I'm using is the ALL() filter. ALL just clears the filter context on the specified table or field and applies a different filter. This can be counter intuitive until you remember that when a user is clicking on data points in Power BI various filters are being applied to the underlying tables, which affects the calculations. So you can either add additional filters or remove filters so you can apply different ones. This is probably the hardest concept to understand when using DAX. Once you get it, you're golden.
The specific filter I'm using is ALL('Demo Data'[Category]) . I'm using this to clear any filters applied to the Category field in the 'Demo Data' table. Notice that I'm not clearing all filters, just the ones on the specific field. In the example, if you use the slicer to select from 'Cars', 'Planes', or 'Trains', the totals at the bottom of the report do not change. However, if you select data points on the columns chart, the totals at the bottom of the report do change. This is because the measures I defined only clear the filters on the Category field, not all filters on the Demo Data table. This allows me to clearly define how my calculations are made and help me get the right answer to my questions.
This example is pretty simple, there's much more than you can do with measures. To get the most from Power BI, learning and practicing how to control filter context with measures will help you find insights and amaze your colleagues.
-Lukasz
Download the Power BI Report from this example
Comments
- Anonymous
April 11, 2016
Thanks for this, nice and simple and a great way to better understand DAX!
