Sample application “I found something interesting”
Another week, another app (and I use “app” loosely – it’s a SharePoint web-part page).
The following sample application is used to allow people to analyze a certain workbook and add insight. The insight may be as simple as marking a certain area in the workbook and pointing people’s attention to it and it may be more complicated- a user may do some analysis in a workbook (drill down, add calculations etc) and publish this modified workbook for others to see. Note that this is a sample application and as such I am mostly just trying to give people ideas and expand what people think can be done with Excel Services on SharePoint 2010.
The first post here will show the application and explain the user experience – the posts after that will revolve around the coding of the solution.
Starting up – a simple viewer
The initial screen of the application shows the user two interesting areas – the right where the workbook is (EWA) and the left where the panel for adding information is:
The idea is that the user navigates/analyses the workbook and when they find something interesting, the use the selection (in the workbook) and the text at the left (title of the find and notes. So, say that the user found an interesting area in one of the sheets (this workbook tracks team bug stats):
In this case, we found an instance where the bug count went up significantly between two months. We select the area in question, then move to the right side to type in our findings:
Great! We then hit the “I found something interesting!” button and get an indication that the link is ready:
The user can now take the link to what they just created and copy it into email to send to someone, or they can go to a link library that contains the interesting things that were found:
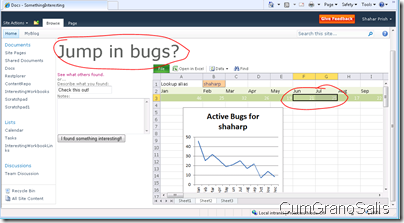
Clicking on this, bring the user directly to the selected area in the workbook that is interesting:
The two marked areas are the difference between landing on the page from the “links of interest” and the initial view on the page (shown at the top). You can see that the title was changed to the title the user who published the workbook created and that the EWA navigated to the correct location in the workbook (the two months with the drop).
Finally, changes in the workbook get saved too – so say the user added an analysis to the bug table presented at the top screenshot:
The line with the average was not there – we added it. If we were to click “I found something interesting”, and the link produced was to be opened, the workbook would contain this further analysis.
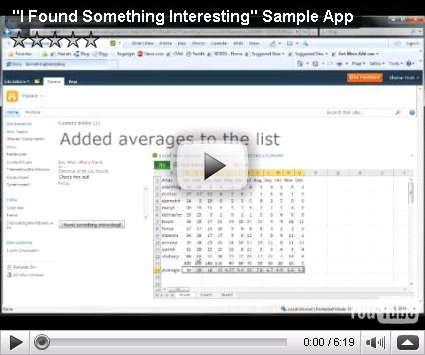
That’s it for today – here’s a video showing the elements of the application one by one:


