MP Author Resource Kit
I realize I haven’t posted anything in awhile – mainly due to my recent change of job within Microsoft (more information on that later). I had to get off my lazy butt to write this post though because the MP Author Resource Kit was just released today. I’ve had the opportunity to play with a beta of these tools, and they are absolutely outstanding. Some of the tools might be classified under the “nice to have” category but others absolutely change the entire authoring experience. Oh the time that these could have save me over the past couple of years…..
The rundown of tools in the new resource kit is as follows:
- Authoring Console
Not too much has changed from the R2 version other than the new resource kit tools getting integrated into the menus. - MP Best Practices Analyzer
Scans the management pack to identify where it might deviate from best practices. Even allows automatic resolution for some issues. Don’t underestimate the recommendations made by this tool. These are very current best practices that have been identified from experience and lessons learned since Operations Manager 207 was released. Don’t let an MP out the door until it passes this analysis. - MP Spell Checker
Does exactly what the name implies. Cool thing is it allows you to maintain an exclusion list with all those application specific terms you deal with. Nothing like a silly spelling error to make your management pack just look cheesy. No more. - MP Visio Generator
Way cool. This creates two Visio diagrams for your service model. One showing class inheritance – all of the base classes that your classes are inheriting from. The other shows the relationships between all of your classes. This is great for documentation of your MP but also nice for analyzing another management pack that you didn’t write. A nice quick diagram of the service model. - MP Diff
Shows the differences between two different management packs. Useful for people like me who create all kinds of demo and sample MPs and then forget what the differences are. - Cookdown Analyzer
Lack of cookdown in rules and monitors targeted at classes with several instances on an agent is one of the biggest sources of overhead from a management pack. This tool will identify classes with the potential for multiple instances and then run an analysis on workflows targeted at them to determine if cookdown may break. - All References Add-in
Right click on any element in a management pack and get a listing of any other referenced elements. Great for quick sanity checks. - Workflow Analyzer
Finally, a means to debug a running workflow! Connect to an agent, select a workflow and watch the output from each module. This one will be useful to operations people in addition to MP authors. - Workflow Simulator
I saved the best for last. There simply aren’t enough nice things I can say about this one. Right click on a rule, monitor, or discovery and select Simulate. You’ll actually run a copy of that workflow right on your workstation and be able to inspect the output from each module right there your workstation. No need for a connection to a management group. You could do this on an airplane! We can actually create custom workflows and test them with just the Authoring Console before ever installing the MP. Now this changes the whole process and has the potential to save authors tons of time.
Just to show how cool the Workflow Simulator is, let me show a couple of screenshots. This is the StoreApp management pack that I’ve used at a couple of conferences for a sample. This particular monitor runs a script that collects a file count from several folders – simulating queues in the sample application.
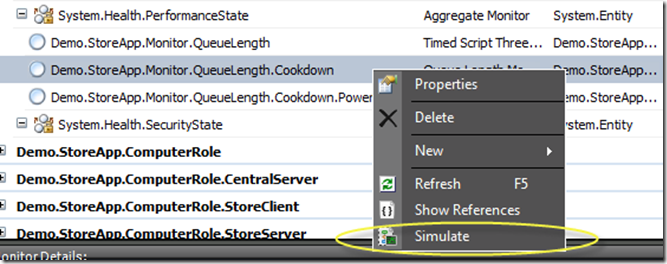
All I have to do is right click on the monitor and select Simulate.
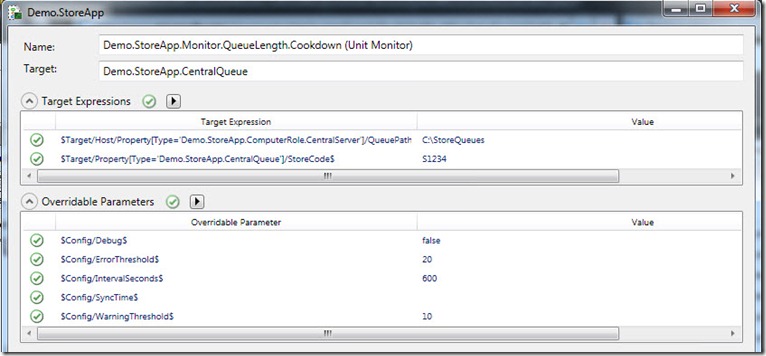
Then I get a dialog box showing me all of the overrideable parameters in case I want to change any for this simulation. I also get any target variables that are being passed to the monitor. When actually running, these are values that we would get from the properties of the target object. In the simulation though we have no target object, so I get the opportunity to provide my own values.
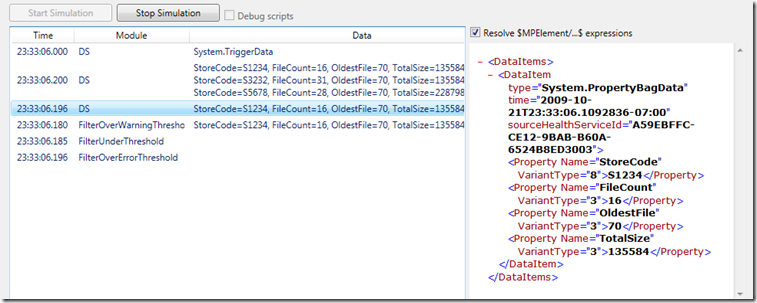
When I’m ready, I hit Start Simulation, and the monitor runs - listing each module and it’s output! Have a look at the screenshot below. I have a timestamp next to each module as it is loaded. You can see that the first data source is the scheduler. Once it fires, the script runs outputting three different property bags – one for each folder that my script finds. I then filter that to a single data source matching the particular folder I’m interested in, and then we see each of the expressions for the health states of the monitor. Right next to each module in the Data column, I can see the values in the resulting property bag. If I want to see the actual XML, it’s in the right pane.
For anyone who is used to only being able to test workflows by installing them and then waiting for them to deploy to the agent this is huge. An authoring experience not requiring a connection to a running environment, a quick means of testing workflows, and complete exposure into the execution and resulting data from each module in the workflow. What more could you possibly ask for?
Bottom line – go get the MP Resource Kit now. I’ve only been using it for a couple of weeks, and I already can’t imagine trying to write an MP without it.
Comments
- Anonymous
January 11, 2012
Hi Brian Wren, I have one issue regarding the debugging. I have instaleld the debugger and so able to select the 'Debug Script' option. My management pack is having script discovery and I want to debug it. When I choose 'Debug Script' option and simulate the discovery, it it not launching the debugger and so i am not able to debug the script. Can you put your views on the same. Thanks, Ashwini


