SQL Swiss Army Knife #13 – Exploring the plan cache – Part 1
Hello all,
In the last few months I’ve been creating a few snippets of code to extract as much useful information from the plan cache as possible. Why to do this?
We at Microsoft GBS PFE deliver a type of service called a SQL Performance Tuning and Optimization Clinic, which is directed at finding and resolving issues with your server configuration, database design and/or T-SQL coding from a performance standpoint, right there in your workplace. Given this, it makes sense to quickly explore what’s going on with your cached plans, for one.
Fixing performance issues by having a proper database design, indexing and well written code is not only better but also much less expensive that upgrading your servers hardware, as a way to minimize performance issues.
Having said that, let’s see how to retrieve valuable information that is sitting right there in your plan cache. If you ever looked at a graphical execution plan, it is nothing more than a well-formed XML file. So it makes sense to use xqueries to explore the richness of information that is stored there.
These are the scripts detailed further below:
- Plans with Missing Indexes
- Plans with Warnings
- Plans with Implicit Conversions
- Plans with Index Scans
- Plans with Lookups
Download scripts here: xqueries_plancache_part1
Part 2 of this series is available here.
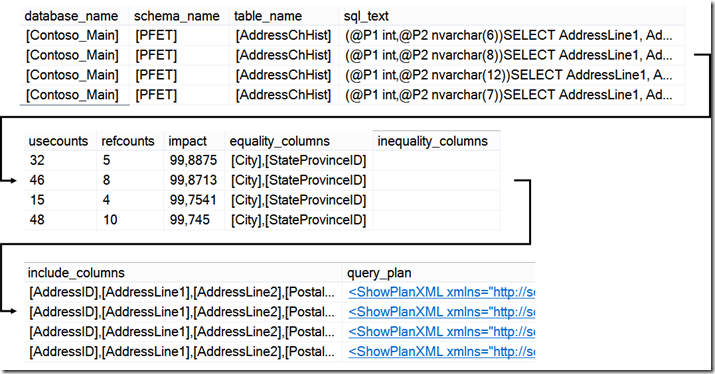
Querying the plan cache for missing indexes
Will allow you to get a sense if the engine is outputting any information on what may be perceived as inadequacy between the current database design and possible benefits of creating new or changing current indexes for your relevant workload.
It may be important to review this information against the current indexes, verify its validity against the importance of the workload it refers to, and always test before making any changes.
Last but not least, in an OLTP environment, never create redundant indexes.
 -- Querying the plan cache for missing indexes
SET TRANSACTION ISOLATION LEVEL READ UNCOMMITTED;
WITH XMLNAMESPACES (DEFAULT 'https://schemas.microsoft.com/sqlserver/2004/07/showplan'),
 PlanMissingIndexes AS (SELECT query_plan, cp.usecounts, cp.refcounts, cp.plan_handle
       FROM sys.dm_exec_cached_plans cp (NOLOCK)
       CROSS APPLY sys.dm_exec_query_plan(cp.plan_handle) tp
       WHERE cp.cacheobjtype = 'Compiled Plan'
        AND tp.query_plan.exist('//MissingIndex')=1
       )
SELECT c1.value('(//MissingIndex/@Database)[1]', 'sysname') AS database_name,
 c1.value('(//MissingIndex/@Schema)[1]', 'sysname') AS [schema_name],
 c1.value('(//MissingIndex/@Table)[1]', 'sysname') AS [table_name],
 c1.value('@StatementText', 'VARCHAR(4000)') AS sql_text,
 c1.value('@StatementId', 'int') AS StatementId,
 pmi.usecounts,
 pmi.refcounts,
 c1.value('(//MissingIndexGroup/@Impact)[1]', 'FLOAT') AS impact,
 REPLACE(c1.query('for $group in //ColumnGroup for $column in $group/Column where $group/@Usage="EQUALITY" return string($column/@Name)').value('.', 'varchar(max)'),'] [', '],[') AS equality_columns,
 REPLACE(c1.query('for $group in //ColumnGroup for $column in $group/Column where $group/@Usage="INEQUALITY" return string($column/@Name)').value('.', 'varchar(max)'),'] [', '],[') AS inequality_columns,
 REPLACE(c1.query('for $group in //ColumnGroup for $column in $group/Column where $group/@Usage="INCLUDE" return string($column/@Name)').value('.', 'varchar(max)'),'] [', '],[') AS include_columns,
 pmi.query_plan,
 pmi.plan_handle
FROM PlanMissingIndexes pmi
CROSS APPLY pmi.query_plan.nodes('//StmtSimple') AS q1(c1)
WHERE pmi.usecounts > 1
ORDER BY c1.value('(//MissingIndexGroup/@Impact)[1]', 'FLOAT') DESC
OPTION(RECOMPILE, MAXDOP 1);
GO
Its output will resemble this:
Querying the plan cache for plans that have warnings
This one is especially useful in SQL Server 2012 and above, where we have many more and quite useful warnings about the plan execution. Bob Beauchemin wrote a post about those here.
Still, you can use from SQL Server 2005 to 2008R2 to find warnings regarding ColumnsWithNoStatistics and NoJoinPredicate.
In SQL Server 2012 and above, this can also get warnings such as UnmatchedIndexes (where a filtered index could not be used due to parameterization) and convert issues (PlanAffectingConvert) that affect either Cardinality Estimate or the ability to choose a Seek Plan.
Also note that we cannot leverage this type of cache exploration queries to know where SpillToTempDb warnings occur, as they are only found when we output an actual execution plan, and not in cached execution plans.
 -- Querying the plan cache for plans that have warnings
-- Note that SpillToTempDb warnings are only found in actual execution plans
SET TRANSACTION ISOLATION LEVEL READ UNCOMMITTED;
WITH XMLNAMESPACES (DEFAULT 'https://schemas.microsoft.com/sqlserver/2004/07/showplan'),
 WarningSearch AS (SELECT qp.query_plan, cp.usecounts, cp.objtype, wn.query('.') AS StmtSimple, cp.plan_handle
      FROM sys.dm_exec_cached_plans cp (NOLOCK)
      CROSS APPLY sys.dm_exec_query_plan(cp.plan_handle) qp
      CROSS APPLY qp.query_plan.nodes('//StmtSimple') AS p(wn)
      WHERE wn.exist('//Warnings') = 1
       AND wn.exist('@QueryHash') = 1
      )
SELECT StmtSimple.value('StmtSimple[1]/@StatementText', 'VARCHAR(4000)') AS sql_text,
 StmtSimple.value('StmtSimple[1]/@StatementId', 'int') AS StatementId,
 c1.value('@NodeId','int') AS node_id,
 c1.value('@PhysicalOp','sysname') AS physical_op,
 c1.value('@LogicalOp','sysname') AS logical_op,
 CASE WHEN c2.exist('@NoJoinPredicate[. = "1"]') = 1 THEN 'NoJoinPredicate'
  WHEN c3.exist('@Database') = 1 THEN 'ColumnsWithNoStatistics' END AS warning,
 ws.objtype,
 ws.usecounts,
 ws.query_plan,
 StmtSimple.value('StmtSimple[1]/@QueryHash', 'VARCHAR(100)') AS query_hash,
 StmtSimple.value('StmtSimple[1]/@QueryPlanHash', 'VARCHAR(100)') AS query_plan_hash,
 StmtSimple.value('StmtSimple[1]/@StatementSubTreeCost', 'sysname') AS StatementSubTreeCost,
 c1.value('@EstimatedTotalSubtreeCost','sysname') AS EstimatedTotalSubtreeCost,
 StmtSimple.value('StmtSimple[1]/@StatementOptmEarlyAbortReason', 'sysname') AS StatementOptmEarlyAbortReason,
 StmtSimple.value('StmtSimple[1]/@StatementOptmLevel', 'sysname') AS StatementOptmLevel,
 ws.plan_handle
FROM WarningSearch ws
CROSS APPLY StmtSimple.nodes('//RelOp') AS q1(c1)
CROSS APPLY c1.nodes('./Warnings') AS q2(c2)
OUTER APPLY c2.nodes('./ColumnsWithNoStatistics/ColumnReference') AS q3(c3)
UNION ALL
SELECT StmtSimple.value('StmtSimple[1]/@StatementText', 'VARCHAR(4000)') AS sql_text,
 StmtSimple.value('StmtSimple[1]/@StatementId', 'int') AS StatementId,
 c3.value('@NodeId','int') AS node_id,
 c3.value('@PhysicalOp','sysname') AS physical_op,
 c3.value('@LogicalOp','sysname') AS logical_op,
 CASE WHEN c2.exist('@UnmatchedIndexes[. = "1"]') = 1 THEN 'UnmatchedIndexes'
  WHEN (c4.exist('@ConvertIssue[. = "Cardinality Estimate"]') = 1 OR c4.exist('@ConvertIssue[. = "Seek Plan"]') = 1)
  THEN 'ConvertIssue_' + c4.value('@ConvertIssue','sysname') END AS warning,
 ws.objtype,
 ws.usecounts,
 ws.query_plan,
 StmtSimple.value('StmtSimple[1]/@QueryHash', 'VARCHAR(100)') AS query_hash,
 StmtSimple.value('StmtSimple[1]/@QueryPlanHash', 'VARCHAR(100)') AS query_plan_hash,
 StmtSimple.value('StmtSimple[1]/@StatementSubTreeCost', 'sysname') AS StatementSubTreeCost,
 c1.value('@EstimatedTotalSubtreeCost','sysname') AS EstimatedTotalSubtreeCost,
 StmtSimple.value('StmtSimple[1]/@StatementOptmEarlyAbortReason', 'sysname') AS StatementOptmEarlyAbortReason,
 StmtSimple.value('StmtSimple[1]/@StatementOptmLevel', 'sysname') AS StatementOptmLevel,
 ws.plan_handle
FROM WarningSearch ws
CROSS APPLY StmtSimple.nodes('//QueryPlan') AS q1(c1)
CROSS APPLY c1.nodes('./Warnings') AS q2(c2)
CROSS APPLY c1.nodes('./RelOp') AS q3(c3)
OUTER APPLY c2.nodes('./PlanAffectingConvert') AS q4(c4)
OPTION(RECOMPILE, MAXDOP 1);
GO
And the output will resemble the following, with the statement, and the operation where the warning occurs:
Querying the plan cache for specific implicit conversions
Implicit conversions are “evil”. Now that I got that out, let me tell you why it is good to look for these, and code in such a way that we can get rid of them.
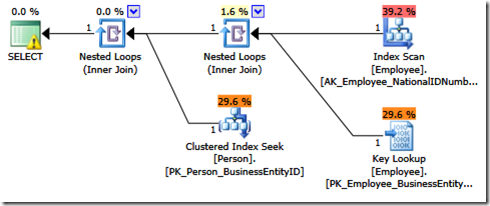
An implicit conversion will have an overhead in your code execution because it will cause CPU cycles to be wasted, and may also limit the query optimizer to make the most appropriate choices when coming up with the execution plan. This is mostly because the optimizer will not be able to do correct cardinality estimations, and with that, it will leverage scans where seeks would be more suitable (this is a generalization). Just look at the following example that will illustrate what I’m saying:
 SELECT p.FirstName, p.LastName, e.NationalIDNumber, e.LoginID
FROM HumanResources.Employee e
INNER JOIN Person.Person p ON e.BusinessEntityID = p.BusinessEntityID
WHERE NationalIDNumber = 112457891
GO
This will generate the following plan, with a PlanAffectingConvert warning inside, because the NationaIDNumber is actually of the NVARCHAR(15) data type, not an integer.
As I stated above, if you are not running on SQL Server 2012 or above, you get no such warning, and that is why searching the plan cache for implicit conversions can be an important exercise.
So this is the code:
 -- Querying the plan cache for specific implicit conversions
SET TRANSACTION ISOLATION LEVEL READ UNCOMMITTED;
WITH XMLNAMESPACES (DEFAULT 'https://schemas.microsoft.com/sqlserver/2004/07/showplan'),
 Convertsearch AS (SELECT qp.query_plan, cp.usecounts, cp.objtype, cp.plan_handle, cs.query('.') AS StmtSimple
     FROM sys.dm_exec_cached_plans cp (NOLOCK)
     CROSS APPLY sys.dm_exec_query_plan(cp.plan_handle) qp
     CROSS APPLY qp.query_plan.nodes('//StmtSimple') AS p(cs)
     WHERE cp.cacheobjtype = 'Compiled Plan'
       AND cs.exist('@QueryHash') = 1
       AND cs.exist('.//ScalarOperator[contains(@ScalarString, "CONVERT_IMPLICIT")]') = 1
       AND cs.exist('.[contains(@StatementText, "Convertsearch")]') = 0
     )
SELECT c2.value('@StatementText', 'VARCHAR(4000)') AS sql_text,
 c2.value('@StatementId', 'int') AS StatementId,
 c3.value('@ScalarString[1]','VARCHAR(4000)') AS expression,
 ss.usecounts,
 ss.query_plan,
 StmtSimple.value('StmtSimple[1]/@QueryHash', 'VARCHAR(100)') AS query_hash,
 StmtSimple.value('StmtSimple[1]/@QueryPlanHash', 'VARCHAR(100)') AS query_plan_hash,
 StmtSimple.value('StmtSimple[1]/@StatementSubTreeCost', 'sysname') AS StatementSubTreeCost,
 c2.value('@EstimatedTotalSubtreeCost','sysname') AS EstimatedTotalSubtreeCost,
 StmtSimple.value('StmtSimple[1]/@StatementOptmEarlyAbortReason', 'sysname') AS StatementOptmEarlyAbortReason,
 StmtSimple.value('StmtSimple[1]/@StatementOptmLevel', 'sysname') AS StatementOptmLevel,
 ss.plan_handle
FROM Convertsearch ss
CROSS APPLY query_plan.nodes('//StmtSimple') AS q2(c2)
CROSS APPLY c2.nodes('.//ScalarOperator[contains(@ScalarString, "CONVERT_IMPLICIT")]') AS q3(c3)
OPTION(RECOMPILE, MAXDOP 1);
GO
That will get an output like the following, where you have the statement, and the “offending” conversion expression:
Querying the plan cache for index scans
This one will allow you to find where we are doing index scans. Why is this important? As you might know, scans are not always a bad thing, namely if you are not being narrow enough in your search arguments (if any), where a scan may be cheaper than a few hundred or thousand seeks. You can read more on a post I did some time ago, regarding a case of seeks and scans.
The following code is most useful by allowing you to identify where scans are happening on tables with a high cardinality, and even look directly at the predicate for any tuning you might do on it.
 -- Querying the plan cache for index scans
SET TRANSACTION ISOLATION LEVEL READ UNCOMMITTED;
WITH XMLNAMESPACES (DEFAULT 'https://schemas.microsoft.com/sqlserver/2004/07/showplan'),
 Scansearch AS (SELECT qp.query_plan, cp.usecounts, ss.query('.') AS StmtSimple, cp.plan_handle
     FROM sys.dm_exec_cached_plans cp (NOLOCK)
     CROSS APPLY sys.dm_exec_query_plan(cp.plan_handle) qp
     CROSS APPLY qp.query_plan.nodes('//StmtSimple') AS p(ss)
     WHERE cp.cacheobjtype = 'Compiled Plan'
      AND (ss.exist('//RelOp[@PhysicalOp = "Index Scan"]') = 1
        OR ss.exist('//RelOp[@PhysicalOp = "Clustered Index Scan"]') = 1)
      AND ss.exist('@QueryHash') = 1
     )
SELECT StmtSimple.value('StmtSimple[1]/@StatementText', 'VARCHAR(4000)') AS sql_text,
 StmtSimple.value('StmtSimple[1]/@StatementId', 'int') AS StatementId,
 c1.value('@NodeId','int') AS node_id,
 c2.value('@Database','sysname') AS database_name,
 c2.value('@Schema','sysname') AS [schema_name],
 c2.value('@Table','sysname') AS table_name,
 c1.value('@PhysicalOp','sysname') as physical_operator,
 c2.value('@Index','sysname') AS index_name,
 c3.value('@ScalarString[1]','VARCHAR(4000)') AS predicate,
 c1.value('@TableCardinality','sysname') AS table_cardinality,
 c1.value('@EstimateRows','sysname') AS estimate_rows,
 c1.value('@AvgRowSize','sysname') AS avg_row_size,
 ss.usecounts,
 ss.query_plan,
 StmtSimple.value('StmtSimple[1]/@QueryHash', 'VARCHAR(100)') AS query_hash,
 StmtSimple.value('StmtSimple[1]/@QueryPlanHash', 'VARCHAR(100)') AS query_plan_hash,
 StmtSimple.value('StmtSimple[1]/@StatementSubTreeCost', 'sysname') AS StatementSubTreeCost,
 c1.value('@EstimatedTotalSubtreeCost','sysname') AS EstimatedTotalSubtreeCost,
 StmtSimple.value('StmtSimple[1]/@StatementOptmEarlyAbortReason', 'sysname') AS StatementOptmEarlyAbortReason,
 StmtSimple.value('StmtSimple[1]/@StatementOptmLevel', 'sysname') AS StatementOptmLevel,
 ss.plan_handle
FROM Scansearch ss
CROSS APPLY query_plan.nodes('//RelOp') AS q1(c1)
CROSS APPLY c1.nodes('./IndexScan/Object') AS q2(c2)
OUTER APPLY c1.nodes('./IndexScan/Predicate/ScalarOperator[1]') AS q3(c3)
WHERE (c1.exist('@PhysicalOp[. = "Index Scan"]') = 1
  OR c1.exist('@PhysicalOp[. = "Clustered Index Scan"]') = 1)
 AND c2.value('@Schema','sysname') <> '[sys]'
OPTION(RECOMPILE, MAXDOP 1);
GO
And the output will resemble this:
Querying the plan cache for Lookups
Searching for lookups, namely on large tables, may be a good way to search for opportunities to fine tune performance from the index standpoint.
If a lookup is being done for a small subset of columns of a table, it may be a chance to review the existing non-clustered indexes, namely the one that is being used in conjunction with the lookup, and possibly add included columns to avoid these lookups.
The following code allows you to search for lookups and give you some information to quickly identify these potential issues:
 -- Querying the plan cache for Lookups
SET TRANSACTION ISOLATION LEVEL READ UNCOMMITTED;
WITH XMLNAMESPACES (DEFAULT 'https://schemas.microsoft.com/sqlserver/2004/07/showplan'),
 Lookupsearch AS (SELECT qp.query_plan, cp.usecounts, ls.query('.') AS StmtSimple, cp.plan_handle
     FROM sys.dm_exec_cached_plans cp (NOLOCK)
     CROSS APPLY sys.dm_exec_query_plan(cp.plan_handle) qp
     CROSS APPLY qp.query_plan.nodes('//StmtSimple') AS p(ls)
     WHERE cp.cacheobjtype = 'Compiled Plan'
      AND ls.exist('//IndexScan[@Lookup = "1"]') = 1
      AND ls.exist('@QueryHash') = 1
     )
SELECT StmtSimple.value('StmtSimple[1]/@StatementText', 'VARCHAR(4000)') AS sql_text,
 StmtSimple.value('StmtSimple[1]/@StatementId', 'int') AS StatementId,
 c1.value('@NodeId','int') AS node_id,
 c2.value('@Database','sysname') AS database_name,
 c2.value('@Schema','sysname') AS [schema_name],
 c2.value('@Table','sysname') AS table_name,
 'Lookup - ' + c1.value('@PhysicalOp','sysname') AS physical_operator,
 c2.value('@Index','sysname') AS index_name,
 c3.value('@ScalarString','VARCHAR(4000)') AS predicate,
 c1.value('@TableCardinality','sysname') AS table_cardinality,
 c1.value('@EstimateRows','sysname') AS estimate_rows,
 c1.value('@AvgRowSize','sysname') AS avg_row_size,
 ls.usecounts,
 ls.query_plan,
 StmtSimple.value('StmtSimple[1]/@QueryHash', 'VARCHAR(100)') AS query_hash,
 StmtSimple.value('StmtSimple[1]/@QueryPlanHash', 'VARCHAR(100)') AS query_plan_hash,
 StmtSimple.value('StmtSimple[1]/@StatementSubTreeCost', 'sysname') AS StatementSubTreeCost,
 c1.value('@EstimatedTotalSubtreeCost','sysname') AS EstimatedTotalSubtreeCost,
 StmtSimple.value('StmtSimple[1]/@StatementOptmEarlyAbortReason', 'sysname') AS StatementOptmEarlyAbortReason,
 StmtSimple.value('StmtSimple[1]/@StatementOptmLevel', 'sysname') AS StatementOptmLevel,
 ls.plan_handle
FROM Lookupsearch ls
CROSS APPLY query_plan.nodes('//RelOp') AS q1(c1)
CROSS APPLY c1.nodes('./IndexScan/Object') AS q2(c2)
OUTER APPLY c1.nodes('./IndexScan//ScalarOperator[1]') AS q3(c3)
-- Below attribute is present either in Index Seeks or RID Lookups so it can reveal a Lookup is executed
WHERE c1.exist('./IndexScan[@Lookup = "1"]') = 1
 AND c2.value('@Schema','sysname') <> '[sys]'
OPTION(RECOMPILE, MAXDOP 1);
GO
And the output will resemble this:
I still have a few more xqueries to share, but I’ll leave those for another time. Hope you find these useful.
Until next time!
Disclaimer: I hope that the information on these pages is valuable to you. Your use of the information contained in these pages, however, is at your sole risk. All information on these pages is provided "as -is", without any warranty, whether express or implied, of its accuracy, completeness, fitness for a particular purpose, title or non-infringement, and none of the third-party products or information mentioned in the work are authored, recommended, supported or guaranteed by Ezequiel. Further, Ezequiel shall not be liable for any damages you may sustain by using this information, whether direct, indirect, special, incidental or consequential, even if it has been advised of the possibility of such damages.
Comments
- Anonymous
August 09, 2013
Good article! Thanks - Anonymous
July 02, 2015
The comment has been removed


