Predicate Pushdown and why should I care?
Cross post with https://aka.ms/sqlserverteam
If you follow this blog, you know that in the last couple years, we have been adding more information to showplan, to make it a one-stop-shop for all your query performance troubleshooting insights. You can see more about those showplan enhancements here.
Hold on, there’s a reason I’m writing about showplan: in this scenario we also enhanced showplan to provide better insights into good index usage in a plan.
First, let’s define a few terms, so we can see how to detect whether we’re making good use of our indexes, as they relate to the queries running in our SQL Server.
- Whenever you submit a query to SQL Server, if it includes a JOIN and/or WHERE clause, that constitutes a row filtering pattern known as a predicate.
- The query optimizer can use that to estimate how to best retrieve only the intended rows, after that predicate has been applied, this surfaces in the query plan as the Estimated Number of Rows.
- When that estimated plan is executed, and you look at the actual execution plan, this surfaces as the Actual Number of Rows. Usually, a big difference between Estimated and Actual number of rows indicates a misestimation that may need to be addressed to improve performance: maybe you don’t have the right indexes in place?
These are the two properties related to rows you had on every SQL Server plan up to SQL Server 2014.
The good!
Keep the above concepts in mind, and let’s see what Predicate Pushdown is with an example. I’m using AdventureWorks2016, and my SalesOrderDetail table was bloated 5 times. Also created the single index below:
 CREATE NONCLUSTERED INDEX [IX_ModifiedDate_OrderQty] ON [Sales].[SalesOrderDetailBulk] ([ModifiedDate] ASC)
INCLUDE ([ProductID],[OrderQty])
GO
Now for the query to test, I’m using this:
 SELECT [ProductID]
FROM [Sales].[SalesOrderDetailBulk]
WHERE [ModifiedDate] BETWEEN '2011-01-01' AND '2012-01-01'
AND [OrderQty] = 2
GO
So just before executing the query, look at the predicates. I see these are over the ModifiedDate and OrderQty columns – my filters. Also note ModifiedDate is the key of the index I created earlier, but OrderQty is not an index key.
The query optimizer always evaluates predicates on top of a table or index scan/range operation (my FROM clause here). Some parts of the filter predicate may match an index key, and may therefore be used to run an index seek or range scan, pushing a predicate down to the storage engine (e.g. Predicate Pushdown), so it only needs to read the required set of data. The remaining parts of the predicate are known as "residual", and must be evaluated for each row the index seek outputs, using a filter operator.
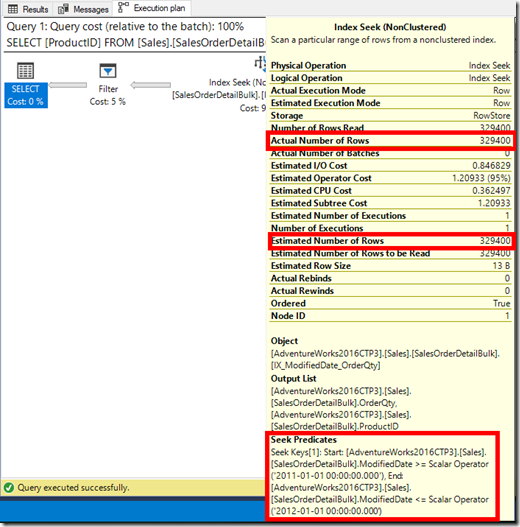
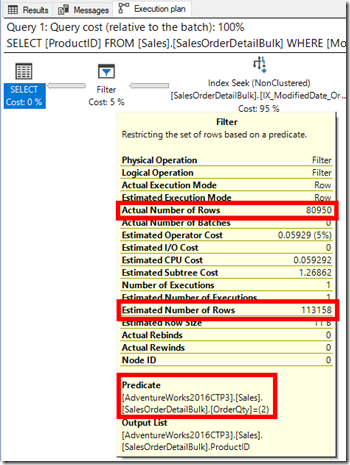
This is what I have in the plan below: an index operation seeking on the BETWEEN predicate (notice the Seek Predicate) because it’s SARGable. The Estimated Number of Rows was 329,400, which corresponds to the Actual Number of Rows. And then a Filter operation on top for the non-SARGable predicate (notice the Predicate), from where the final matching 80,950 rows are output. Note the QueryTimeStats for this query are 186ms CPU for 939ms elapsed time.
| Note: If you want to dig deeper into where this index seek estimation comes from, we also output to showplan which statistics were used by the query optimizer (see more here). Using this information and looking at the loaded statistics, the 329,400 rows correspond to the number of rows over the ModifiedDate column in a single-column loaded stat, for the histogram steps that match the BETWEEN clause. |
The better!
But I’m actually holding back SQL Server with the plan above. SQL Server could actually have implemented it’s default behavior of full predicate pushdown – meaning pushing down both the SARGable and non-SARGable predicates in one single operation.
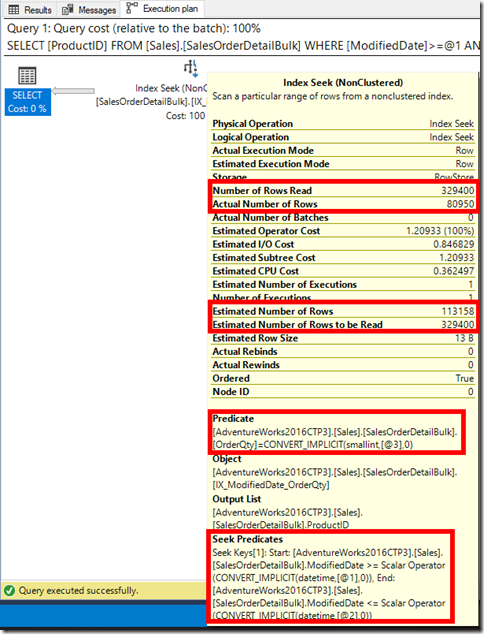
Let’s remove all the breaks and allow SQL Server to do its thing. The same query now yields the plan below: no more Filter operator, and both predicates were pushed down to the storage engine to resolve in the Index Seek. The QueryTimeStats for this query are 104ms CPU for 897ms elapsed time. In this small example, notice the 45 percent CPU drop.
Just the Estimated Number of Rows and the Actual Number of Rows properties don’t tell the full story for anyone looking to troubleshoot a query performance, where the observed I/O doesn’t really go hand-in-hand with the number of rows returned. You need more data to really reason about your underlying index design, as they relate to your queries. Which is why we added the Number of Rows Read back in SQL Server 2016, and Estimated Number of Rows to be Read in SQL Server 2016 SP1 (both also back-ported to SQL Server 2012 SP3 and 2014 SP2). This actually tells you how many rows are read in order to resolve your query, before any predicates are applied.
We see also that while the Estimated Number of Rows was 113,158, the Estimated Number of Rows to be Read was 329,400 (we’ve seen this before in the previous plan). Comparing these two numbers - before and after any predicates are applied - which are present even in the Estimated Execution Plan, tells us that while our index could be further optimized for this critical predicate.
Tip: These two properties are also in your cached plans, so you can explore your cache for those plans that have big differences, and maybe tune those queries and/or underlying index design.
This observation is confirmed by the runtime data: while the Actual Number of Rows was 80,950 (the output *after* applying all predicates), the Number of Rows Read was 329,400. This is a direct measure of the required I/O for my predicates. So these two new properties really allow you insights you could only guess before.
The Best!
So at this point I know SQL Server did its best with the indexes it had, but I now know what to do next for my critical predicate. Assume for a moment that while dates may change in my query, I mostly search for products with an OrderQty = 2. Then I can use this to modify my index with a filter, as below:
 CREATE NONCLUSTERED INDEX [IX_ModifiedDate_OrderQty] ON [Sales].[SalesOrderDetailBulk] ([ModifiedDate] ASC)
INCLUDE ([ProductID],[OrderQty])
WHERE [OrderQty] = 2
GO
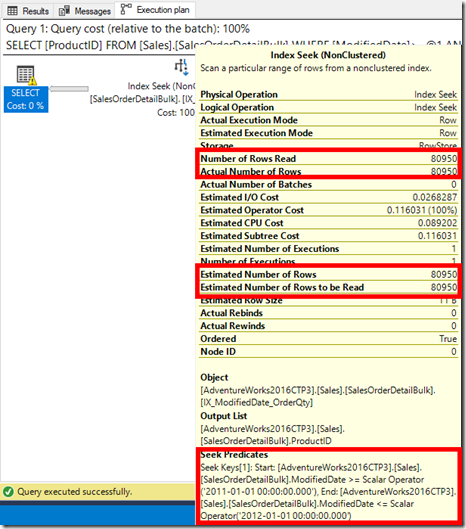
Which gives me the below plan (ignore the unmatched index warning, we actually used it). SQL Server estimated and really read *only* the required rows for the output: Estimated Number of Rows = Estimated Number of Rows to be Read, and Actual Number of Rows = Number of Rows Read.
In conclusion…
SQL Server will always try to pushdown all predicates that are covered by an index, even though when your index is not perfectly tailored for your predicates, which may be fine.
To get the I/O to be as close as possible to your required rowcount, you need to first understand if you are facing an issue due to excessive I/O (even without executing the query, by looking at estimations alone). Being able to leverage the showplan properties seen here is an invaluable tool to troubleshoot query performance, and fine tune your indexes and statistics.
Pedro Lopes (@SQLPedro) – Senior Program Manager


