Tool of the month: Microsoft Service Trace Viewer
I was quite busy during the last two months, but today I’m back with a new post.
If you use WCF, you’ve probably already come across this tool, which is mostly marketed as WCF’s troubleshooting companion. However, it’s actually a very useful utility for general .NET troubleshooting. Note that this post does not aim to be a complete guide to WCF tracing, which is documented here. Instead, it gives some background to tracing and shows where Service Trace Viewer really shines.
Tracing on .NET standards
WCF builds on the well established System.Diagnostics namespace to produce traces. This is not just a good design decision to reuse code, but also allows to share common concepts with other types of .NET tracing sources.
The most important concept here is activities. An activity is a container for a series of logically related operations. For example, everything that constitutes sending a message to a server could be grouped into a single activity. If one step itself consists of fair amount of work, it could have its own activity. The great thing about activities is that any trace output will be associated to the current activity (using a thread-static variable containing the ActivityId). This allows you to understand the context of a trace output.
Furthermore, activities are hierarchical – so, another way of looking at them is a logical call stack. This enables us to put trace events into an even broader context.
Another concept is a listener. They act as collectors for trace sources in .NET. Listeners can be either private or shared, but as you’d guess, a shared one has the advantage of collecting trace output from various sources. If you’re planning to use Service Trace Viewer, you’ll need to employ System.Diagnostics.XmlWriterTraceListener, because this is the native format for the tool.
When used together, you can group traces from various sources into a single log file, and have a great overview of what’s happening in the process.
For an example, let’s consider the following tracing configuration:
<?xml version="1.0" encoding="utf-8" ?>
<configuration>
<system.diagnostics>
<sources>
<source name="System.ServiceModel" switchValue="Information,ActivityTracing"
propagateActivity="true">
<listeners>
<add name="ServiceModelTraceListener"/>
</listeners>
</source>
<source name="System.Net.Sockets" switchValue="Information">
<listeners>
<add name="ServiceModelTraceListener"/>
</listeners>
</source>
<source name="System.Net" switchValue="Information">
<listeners>
<add name="ServiceModelTraceListener"/>
</listeners>
</source>
</sources>
<sharedListeners>
<add initializeData="c:\temp\client_tracelog.svclog"
type="System.Diagnostics.XmlWriterTraceListener, System, Version=2.0.0.0, Culture=neutral, PublicKeyToken=b77a5c561934e089"
name="ServiceModelTraceListener" traceOutputOptions="LogicalOperationStack, DateTime, Timestamp, ProcessId, ThreadId, Callstack"/>
</sharedListeners>
<trace autoflush="true" />
</system.diagnostics>
.
.
.
</configuration>
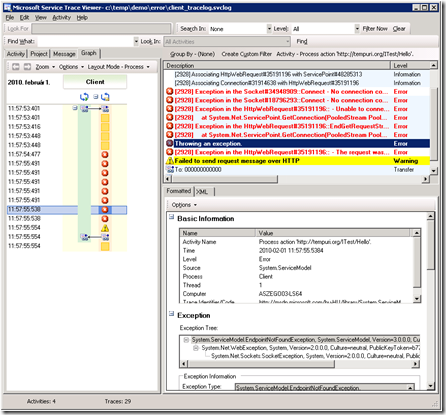
This will trace all socket (System.Net.Sockets), HttpWebRequest, ServicePoint, etc. (System.Net) and WCF (System.ServiceModel) activities at Information level, with the nice context that activities provide (for more informatino on the former trace sources, surf to https://msdn.microsoft.com/en-us/library/ty48b824(VS.80).aspx). This is best viewed with the “Graph” mode within Service Trace Viewer:
Note that you can double-click an activity transfer (e.g.’From: Processing message 1.’ below) to travel down or up in the hierarchy. Also, be aware that the tool by default hides activities and trace events that you haven’t visited yet. These can be unfolded using either the adjacent or the column header’s plus sign.
End-to-End tracing
Fortunately, WCF provides the propagateActivity attribute that essentially writes the current ActivityId to a special SOAP header. When a WCF service gets such a header, it’ll set its ActivityId to correlate processing with the corresponding client activity. When you’re done with collecting the traces, you just need to open any of the traces in Service Trace Viewer, and then use File | Add to correlate the other traces. Message traces are no exception: if you have traced messages into a separate log file (which is the default configuration when using WCF Service Configuration Editor), you can use this menu item to correlate them with the trace.
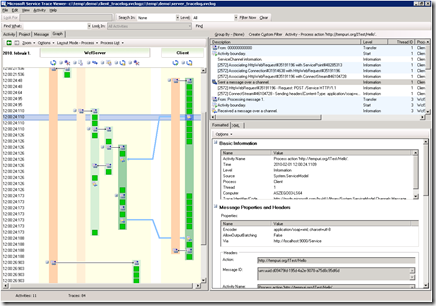
Using the same configuration above, a successful message sending and processing on server-side looks like:
Notice that the tool nicely connects the correlated activities with a blue arrow between client and server. Of course, there’s nothing that would limit such correlation to a client-server scenario – an n-tier application’s internal processing could be followed just as well.
Custom traces
Just like WCF uses System.Diagnostics for tracing purposes, it’s a good idea to use it for your custom tracing, too. With Service Trace Viewer, it’s an even better idea J. See https://msdn.microsoft.com/en-us/library/aa738759.aspx for code samples on how to do this.
Also displays ETW traces
While not directly related to the discussion above, it’s good to know that whenever you have to view ETW traces (*.etl files) collected from Windows Log Manager, you can use Service Trace Viewer as it supports this format. You can even collect ETW traces along with .NET traces. Details are here: https://msdn.microsoft.com/en-us/library/ms751538.aspx.
Searching, Filtering, etc.
Service Trace Viewer has a few more handy features. I encourage you to have a look at its MSDN documentation, https://msdn.microsoft.com/en-us/library/ms732023.aspx.

