Default Trace and System Health
So it’s been a little while since my last posting – actually a long while. Since my last post some 8 months ago I’ve changed customers in my role as a PFE here at Microsoft and that has had me quite busy.
I have a couple of posts I wanted to write to answer some questions I get from customers in our SQL Server Performance Tuning and Optimization Workshops – and to get back into updating my blog. So the question for this post:
Question: What is captured by the default trace?
This is actually a pretty simple question to answer if you know the right function to query in SQL Server – and you can undoubtedly find it by Binging it. However, I’m going to go ahead and outline it here combined with the system_health extended events trace – new starting in SQL Server 2008.
SQL Trace Default Trace
To get the events captured in SQL Server by the default trace, we just need to supply the trace id for the default trace to the fn_trace_geteventinfo function and join this to sys.trace_events to map the event id’s to their event names:
declare @handle int = (select id from sys.traces where is_default = 1);
select distinct e.eventid, n.name from
fn_trace_geteventinfo(@handle) e
join sys.trace_events n
on e.eventid = n.trace_event_id
order by n.name asc
which gives us the event id and it’s event name captured by the default trace:
if you wish to get the actual data out of the default trace files – there are 5 by default, then you can do the following to see what configuration and schema changes have been made on your system in the last 5 restarts of your SQL Service or in the last 100 MB of trace data – whichever comes first (the default trace automatically starts a new file at 20MB and maintains 5 files):
declare @def_trace nvarchar(250) = (select path from sys.traces where is_default = 1)
select e.name, x.* from
fn_trace_gettable(@def_trace, 5) x
join sys.trace_events e
on x.EventClass = e.trace_event_id
System Health Extended Event Trace
Starting with SQL Server 2008, we have a new tracing and diagnostic capability known as Extended Events. Extended Events is a much more robust way of collecting diagnostic and performance data on your SQL Server. It’s designed to be much more efficient when firing events. Additionally, filtering has been pushed down to the code level so that if the event doesn’t meet the criteria, it isn’t published.
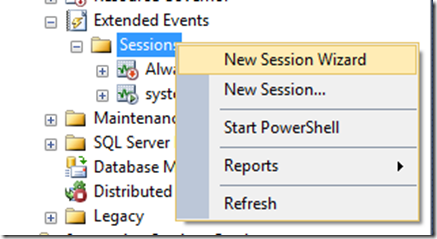
In SQL Server 2008 you had to learn the syntax for creating Extended Event Sessions. The syntax isn’t bad, but the XPath style queries to process the results into rowsets is a bit tricky. In SQL Server 2012, we have a UI Wizard to help us perform these collections with ease:
In fact, SQL Trace is being deprecated in favor of Extended Events:
Deprecated Database Engine Features in SQL Server 2012
https://technet.microsoft.com/en-us/library/ms143729(SQL.110).aspx
I don’t want to go into explaining how Extended Events work – or how to use them here. Virtual reams have already been written on those topics. Just know that in SQL Server 2012 the number of events has increased dramatically and it’s hard to imagine something you can’t capture using Extended Events. Jonathan Kehayias does a good job of explaining how to use Extended Events in a nice lesson-per-day format here:
An XEvent A Day: 31 days of Extended Events
https://sqlblog.com/blogs/jonathan_kehayias/archive/2010/12/01/a-xevent-a-day-31-days-of-extended-events.aspx
In this post, I simply wanted to show you how to see which events are being captured in the new default system_health extended event session – much like the default trace above. You can see which sessions are active using:
select * from sys.dm_xe_sessions
Where you should see at least:
This new system_health extended events session is there to help product support troubleshooting basic, common performance problems. But what is it capturing? That information can be found using this query:
select * from sys.dm_xe_session_events e
inner join sys.dm_xe_sessions s
on e.event_session_address = s.address
which gives us:
Now some of these events have predicates for filtering what is captured. The predicate is used to filer what is captured so we don’t try to gather too much information – information that may not be useful to product support – like waits that aren’t common causes of performance problems. Extended event sessions have “targets” where they write their data to. The system_health session logs all data into a ring_buffer (and an event_file in SQL Server 2012 – called an asynchronous_file_target in SQL Server 2008). The ring_buffer is a circular buffer in memory that will wrap around and overwrite old records once it fills up. So how do you read the contents? Cast the data to XML and then extract it with an XPath query:
declare @sys_health xml;
set @sys_health = ( select cast(t.target_data as xml)
from sys.dm_xe_session_targets t
join sys.dm_xe_sessions s
on t.event_session_address = s.address
where s.name = 'system_health' )select
n.value('(@name)', 'nvarchar(50)') as [event name],
n.value('(data[@name="wait_type"]/text)[1]', 'nvarchar(50)') as wait_type,
n.value('(data[@name="duration"]/value)[1]', 'bigint') as duration,
n.value('(action[@name="sql_text"]/value)[1]', 'nvarchar(4000)') as stmt_text
from @sys_health.nodes('/RingBufferTarget/event') as q(n)
and on my server we get:
- Jay
Comments
- Anonymous
June 13, 2013
this is a complete procedure to query default trace for different events kind. Hope can be useful: zaboilab.com/.../anayze-sql-default-trace-to-investigate-instance-events


