Remote Execution and Data Collection
As promised, I will spend a few posts talking to you about remote execution and data collection. So far I have talked about specific features related to testing in the upcoming release of the VS 2010 product. While running tests on one’s own desktop is great for development of your product or your tests, but when it comes to testing your product we really need to be thinking about execution across multiple machines and leverage diagnostics information. This really enables testing at scale, as well as testing against real deployment configurations.
The first part of this story is remote execution. One of the great features of our 2010 offering is the ability to provision environments to satisfy the needs of the testing effort. In order to fully exploit that functionality we need to be able to schedule, deploy, and execute tests against an ever changing array of test systems. To pull this off we rely on a Test Agent Controller to schedule and coordinate testing, and Test Agents on each machine to handle the test execution and data collection. The simplest remote execution scenario requires an installation of Visual Studio, the Test Agent Controller and a Test Agent. While this can all be installed on the same machine, the differences between local and remote execution will really be highlighted when you have access to more than one agent across which to execute tests.
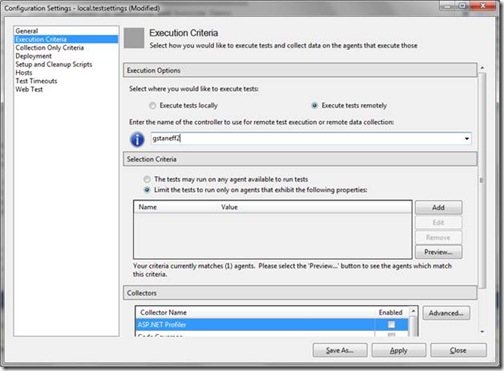
Enabling remote execution can be accomplished in Visual Studio by updating a test project’s testsettings file (Local.testsettings in a default test project) or by customizing a Test Settings associated with a Test Plan in Camano. In Visual Studio the test settings options are available from the Test Menu and the Edit Test Settings option, and in Camano there is a Test Settings wizard to streamline configuration. Since we’re working through a simplistic case we will edit the test setting in Visual Studio, select the Execution Criteria option in the dialog, check the radio button to Execute tests remotely, and provide the name of the Test Agent Controller we wish to schedule our test run against.
Prior to modifying the test settings, test execution would occur on the local machine but since we’ve enabled remote execution, when we start our test now the execution will occur on an agent selected by the Test Agent Controller. Initiating a test run will cause Visual Studio to contact the test agent controller, schedule the test against appropriate test agents, deploy our test code, and execute the test on the agent machine. After the test completes, the agent gathers the results and data to return to the test agent controller, which in turn passes that information back to the client that initiated the test run.
As we would expect from local execution, remote execution also populates the Test Results window with test run progress and test results. To see that we’re actually executing our tests remotely we can create a simple test method to print out the computer name and run the test both locally and remotely like so:
[TestMethod]
public void TestMethod1()
{
Console.WriteLine(SystemInformation.ComputerName);
}
And see that in the local case the test prints out the desktop client name (in this case “gstaneff2”) but in the remote case we get the name of one of the agents attached to the controller – for example, “MSL-2108091.”
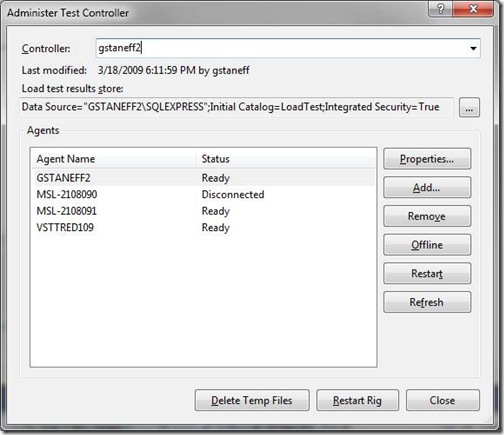
As we scale out our test lab further we can queue several tests at once against a Test Agent Controller with several attached agents. It then is the responsibility of the controller to parcel out these pending tests based on a variety of criteria such as the properties of the agent machines, which roles are enabled on each agent (roles specify the diagnostic data collectors installed on a group of agents), the load already being carried by each agent and the agent status.
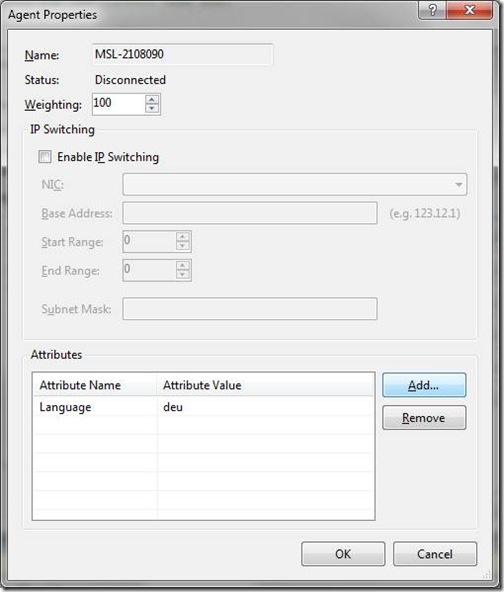
Agent properties are simply Name-Value pairs assigned to each agent in your test lab. If, for instance, some of your agents were running on an English OS and other agents were running on German OS a Language property would be a sensible way to filter available agents for language specific test executions. Agent properties can be added to agents via the Administer Test Agent Controllers dialog in the test menu. The following dialog shows setting of the Language property to the value ‘deu’ for the agent MSL-2108090.
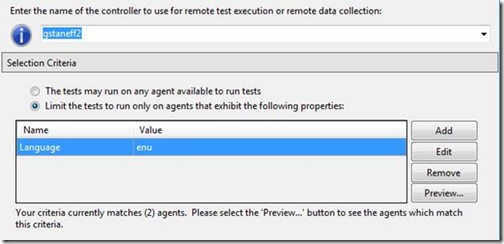
Once our agents have properties we can then instruct the test agent controller to schedule our test run against only those agents that satisfy our requirements:
You’ll note the text under the agent properties list provides the number of agents that meet the specified criteria. The default filter in the testsettings will select agents that include the specified properties. Since by default there are no properties specified this filter will return all agents associated with the specified Test Agent Controller. Since we’ve added a Language property above, we have filtered the total number of agents associated with this controller down to the two agents that happen to have this property set to this value. Notably absent from this list, is the Agent MSL-2108090 for which we just set the value of ‘deu’ for the Language property.
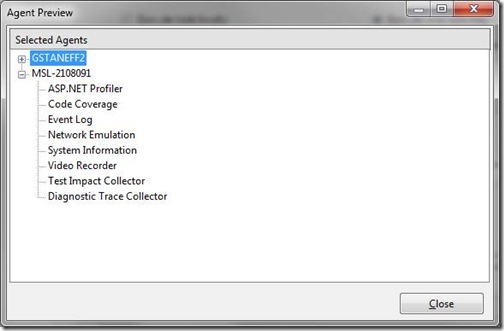
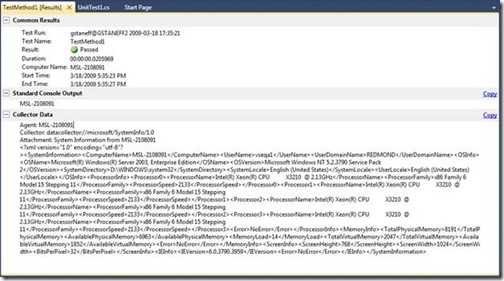
The preview button shows all the agents that satisfy the specified agent properties, but the Agent Preview dialog shows additional information associated with each Agent – a list of Diagnostic Data Adapters that are currently installed on each agent. Diagnostic Data Adapters are like the sidebar gadgets of test execution. They provide functionality to collect information or impact the computer while a test is running that can be enabled or required as part of the test planning process. This frees each test case up from having to collect these information on their own, so they can concentrate on whatever it was they were actually testing. These adapter lists serve as an additional level of filtering, as the Test Agent Controller will not schedule a test run against an agent that does not belong to a role with the required diagnostic data adapter installed. At present the System Information data collector is enabled by default and that means these tests we’ve been running have been passing back a lot of free data about the environment during the test execution:
This, then, illustrates one of the key strengths of the Data Collector concept. It is not a stretch to think of a test case that depends on the Platform/OS/numProcs/Lang/etc. of the system running the test – that a defect may depend on the particular details of the environment. A Diagnostic Data Adapter eliminates the need for each test to implement or call routines required to collect this data (and to know a priori which data will be valuable). During creation of each test plan these adapters can be enabled or disabled as required by the testing effort with no change to the test code itself. By enabling data collectors on the project level in Visual Studio or the plan level in Camano it is possible to establish an organizational policy on what kinds of data to collect for any test case – and this helps us ensure that bug reports generates as a result of our tests contain high quality actionable data.
As the above image of the Agent Preview dialog shows, we have several data collectors planned for this release. We don’t, however, assume to know the particular requirements or needs of every test organization out there and understand our standard data collectors won’t fit all needs equally well. The adapter interface is public and we expect organizations to be able to easily customize their own adapters tailored specifically to their own needs. Once you’ve created and installed your adapter it will show up in the testsettings Execution Criteria options with the others:
While in this post I talked about the System Info data collector, in the next couple of posts I will share with you the details and power of couple of other collectors that we will ship in the box – the Test Impact data collector, and the Diagnostic Trace Data collector. I will also show you how to can add your own data collector and test type, leveraging the extensibility architecture in our product.
Since I’ll be on this topic for a while, please comment on what we’ve shown thus far so I can address it in subsequent posts.
Comments
- Anonymous
March 31, 2009
PingBack from http://blog.openquality.ru/software-quality-news-0309/ - Anonymous
April 02, 2009
The comment has been removed - Anonymous
April 10, 2009
The comment has been removed - Anonymous
August 13, 2009
This is great. Can you explain how data collections work for web applications where data we want to collect is on IIS? That is, the test starts on some client machine (local or remote that has the agent) that has a browser, but the data that we want to collect is on IIS where the web application is actually running (say I want to capture memory usage on IIS). Do I create and install the data collector on IIS, or do I need to create HTML page on IIS/webapp that the data collector on the client machine can access through HTTP? - Anonymous
August 18, 2009
Thanks for the post. I would also like to know how to implement Data Collectors for webapps.Per John T's comments how should this be done? Were does our custom implmentation of the DataCollector need to reside?Do Camano and Test Runner also support Data Collectors? - Anonymous
September 28, 2010
The comment has been removed - Anonymous
October 03, 2010
Goran,There is no need to deploy the test code. The controller knows the dll's (and their dependent files) needed to run a particular test case, and streams the test binaries to the machine involved in executing the test cases.Let us know the results of your work.thanks,Varada - Anonymous
October 06, 2010
The comment has been removed - Anonymous
October 06, 2010
The comment has been removed
