Diagnose Unexpected Failover or Availability Group in RESOLVING State
AlwaysOn availability groups use Windows Cluster to 1) detect the health of the SQL Server process that hosts the primary replica, and 2) to fail over the availability group resource, if configured to do so. During the time a health issue is detected, the availability group primary replica transitions from PRIMARY to the RESOLVING role and if configured for automatic failover, will transition back out of RESOLVING to the PRIMARY role on the automatic failover partner. During the time that the availability group is in the RESOLVING role, the availability databases cannot be accessed by your application.
When your availability group replica transitions to RESOLVING, this is effectively an outage in your production environment. The purpose of this blog is to help you diagnose more common health issues detected by AlwaysOn in order to avoid their future impact. Each scenario below lists a common health issue, how to investigate its root cause and mitigation steps.
Diagnose Lease Timeout (Triggered on FAILURE_CONDITION_LEVEL 1 - 5)
The lease is a heartbeat that detects the SQL Server process health hosting the primary replica. A thread runs at priority inside the SQL Server and communicates via a Windows event with the SQL Server resource DLL-hosted process (RHS.EXE) - if that thread does not respond within the lease timeout period, the SQL Server resource DLL reports a lease timeout and the availability group resource transitions to RESOLVING state and fails over if configured to do so.
If SQL Server cannot respond within the default 20 second lease timeout period, then a lease timeout can be triggered. The following are the most common causes for a lease timeout in SQL Server and how to determine the root cause and mitigate the impact to your production environment.
The lease health check cannot be disabled it is active for all FAILURE_CONDITION_LEVEL settings, 1-5.
For more information on lease timeout, see
How It Works: SQL Server AlwaysOn Lease Timeout
Lease Timeout CAUSE - SQL Server dump diagnostic
SQL Server may detect an internal health issue like an access violation, or deadlocked schedulers, and responds by producing a mini dump file of the SQL Server process for diagnostic purposes. This ‘freezes’ SQL Server for a number of seconds while mini dump is written to disk. During this time, all threads within the SQL Server process are in a 'frozen' state, including the lease thread being monitored by the SQL Server Resource DLL, resulting in a lease timeout.
Review the SQL Server error log
Review the SQL Server error log for message 19407, which is the lease timeout message. Once you find the 19407 message, look immediately prior to the 19407 in the error log for any indication of an event that resulted in SQL Server producing a dump file. In the example output from a SQL Server error log below, SQL Server produced a dump because of a detected scheduler deadlock. During the period in which the dump file was created, SQL Server did not respond to the lease health mechanism and a lease timeout was triggered immediately following the dump diagnostic:
2014-11-02 21:21:10.59 Server **Dump thread - spid = 0, EC = 0x0000000000000000
2014-11-02 21:21:10.59 Server ***Stack Dump being sent to C:\Program Files\Microsoft SQL Server\MSSQL12.MSSQLSERVER\MSSQL\LOG\SQLDump0001.txt
2014-11-02 21:21:10.59 Server * *******************************************************************************
2014-11-02 21:21:10.59 Server *
2014-11-02 21:21:10.59 Server * BEGIN STACK DUMP:
2014-11-02 21:21:10.59 Server * 11/02/14 21:21:10 spid 1920
2014-11-02 21:21:10.59 Server *
2014-11-02 21:21:10.59 Server * Deadlocked Schedulers
2014-11-02 21:21:10.59 Server *
2014-11-02 21:21:10.59 Server * *******************************************************************************
2014-11-02 21:21:10.59 Server * -------------------------------------------------------------------------------
2014-11-02 21:21:10.59 Server * Short Stack Dump
2014-11-02 21:21:10.76 Server Stack Signature for the dump is 0x00000000000002BA
2014-11-02 21:21:19.56 Server Error: 19407, Severity: 16, State: 1.
2014-11-02 21:21:19.56 Server The lease between availability group 'ag' and the Windows Server Failover Cluster has expired. A connectivity issue occurred between the instance of SQL Server and the Windows Server Failover Cluster. To determine whether the availability group is failing over correctly, check the corresponding availability group resource in the Windows Server Failover Cluster.
2014-11-02 21:21:19.56 Server AlwaysOn: The local replica of availability group 'SQLNODE1' is going offline because either the lease expired or lease renewal failed. This is an informational message only. No user action is required.
2014-11-02 21:21:19.56 Server The state of the local availability replica in availability group 'ag' has changed from 'PRIMARY_NORMAL' to 'RESOLVING_NORMAL'. The state changed because the lease between the local availability replica and Windows Server Failover Clustering (WSFC) has expired. For more information, see the SQL Server error log, Windows Server Failover Clustering (WSFC) management console, or WSFC log.
Lease Timeout CAUSE - 100 % CPU utilization
If CPU utilization is very high during a period of time, this can result in a lease timeout. Monitor for high CPU utilization using Performance Monitor.
- Launch Performance Monitor on the server hosting the primary replica of the SQL Server availability group.
- In the left pane, under Data Collector Sets right click 'User Defined' and then New and then Data Collector Set.
- Give the data collector a name and specify 'Create from a template' and click Next.
- Choose System Diagnostics template and click Finish.
- Under the User Defined data sets in the left pane, right-click the new data collector and choose Start.
- Leave data collection running until the lease timeout event re-occurs, then stop the data collector, open the log in Performance Monitor and review the Processor / % Processor Time counter to see if sustained CPU utilization is detected during the time of the lease timeout.
To get an exact time for the lease timeout, review the SQL Server error log, searching for the following message:
2014-11-02 21:21:19.56 Server The lease between availability group 'ag' and the Windows Server Failover Cluster has expired. A connectivity issue occurred between the instance of SQL Server and the Windows Server Failover Cluster. To determine whether the availability group is failing over correctly, check the corresponding availability group resource in the Windows Server Failover Cluster.
Mitigation
Temporarily adjust the availability group lease timeout property, while researching and resolving the issue that the SQL Server dump diagnostic reported.
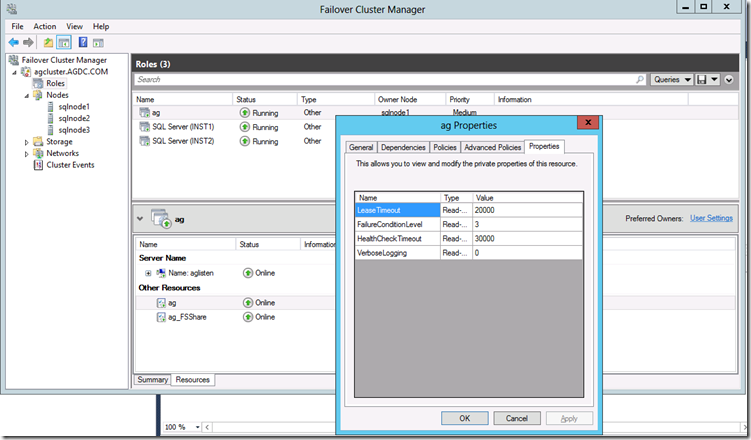
- Launch Failover Cluster Manager.
- In the left pane, click Roles.
- In the middle pane, right-click the availability group clustered resource and click Properties.
- Click the Properties tab and increase the LeaseTimeout in milliseconds. The maximum value is 100,000 ms.
Diagnose Internal SQL Server health (FAILURE_CONDITION_LEVEL 3 - 5)
AlwaysOn health detection introduces new rich health monitoring that takes into account the internal health state of SQL Server.
Internally, SQL Server executes sp_server_diagnostics which returns a rich diagnostic data set, reporting on SQL Server health components such as memory, scheduler, etc. If an error state is returned for one of these health components, the SQL Server resource DLL can respond by triggering the availability group to transition to RESOLVING role and failover if configured to do so.
The sp_server_diagnostics results are stored in the clustered diagnostic log files in the SQL Server \LOG directory with file names SRVNAME_SQLINSTANCENAME_SQLDIAG_XXX.XEL. The cluster diagnostic log contents can be viewed and filtered by opening the files in SQL Server Management Studio.
If an availability group transitioned to the RESOLVING role, because an error state was returned for one of these health components, review the component_health_results events in the cluster diagnostic log for ERROR state. By looking for these ERROR state events, we can determine what the health issue in SQL Server triggered the availability group to transition to the RESOLVING state and event failover if configured to do so.
The sp_server_diagnostics results are only utilized to monitor health when FAILURE_CONDITION_LEVEL is set to 3-5. For more information on the FAILURE_CONDITION_LEVEL settings and which will trigger availability group state change, see:
Flexible Failover Policy for Automatic Failover of an Availability Group (SQL Server)
Review Cluster Diagnostic Log (SRVNAME_SQLINSTANCE_SQLDIAG_XXX.XEL)
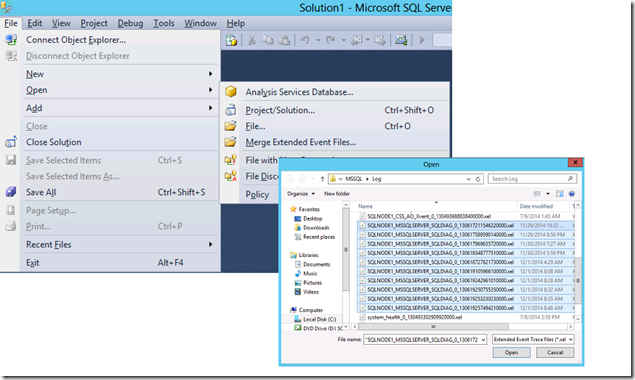
Launch SQL Server Management Studio and open all the cluster diagnostic logs in the SQL Server \LOG subdirectory using ‘Merge Extended Event Files’ feature:
- Launch SQL Server Management Studio.
- From the File menu choose Open and then Merge Extended Event Files. Click the Add button in the dialog that appears.
- Drill into the SQL Server \LOG folder and shift+click to select each of the cluster diagnostic logs and click Open.
Filter for component_health_result events that report ERROR state description
When certain component_health_result events report an error state, your availability group may transition to RESOLVING or automatically failover. To check for the error state in the cluster diagnostic logs:
- From the Extended Events menu choose Filters.
- In the Field column choose state_desc.
- Leave the Operator as '=' and for the value enter ‘error’ without the quotes.
- Click Ok.
EXAMPLE 1 Review the cluster diagnostic logs
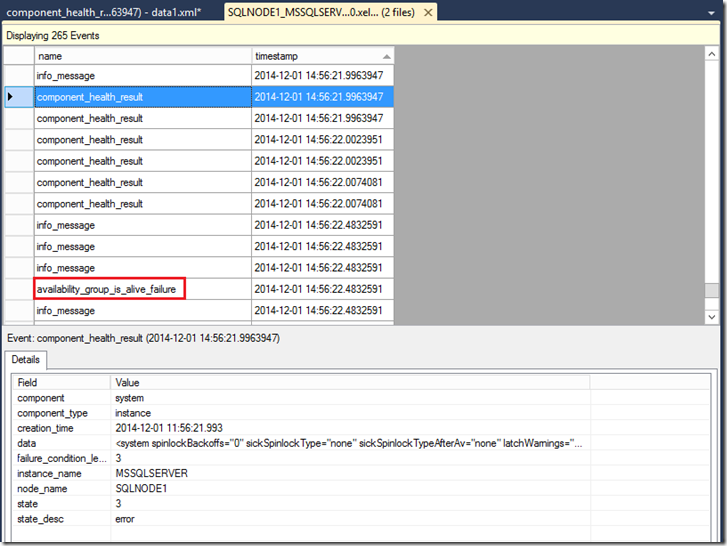
Consider a scenario where the availability group FAILURE_CONDITION_LEVEL is set to 3 and a health issue transitions the availability group from PRIMARY to RESOLVING. To diagnose, open the cluster diagnostic logs on the primary replica, and by filtering we find a system component_health_result event reporting error. Now that we know the time frame, we disable the filtering and also see a availability_group_is_alive_failure event, indicating that the availability group transitioned to the RESOLVING role and may have initiated failover if configured to do so.
What SQL health issue caused the error state on the system component _health_result event? Double-click the data element in the Details pane – this will launch a new window in SSMS with the raw XML health data. We can see that the totalDumpRequeusts is an unusually large 118 dumps, and we know that AlwaysOn health detects dump volume as a health metric.
EXAMPLE 2 Review the cluster diagnostic logs
In the next example, a serious health issue occurs on the primary, a scheduler deadlock, but the availability group did not transition to RESOLVING and never failed over. Opening the cluster diagnostics logs, we find a query_processing component_health_result event reported state of error. Looking at the data field in the Details pane, we see HasDeadlockedSchedulersOccurred=1.
Here we do not observe a corresponding availability_group_is_alive_failure event. Why? The availability group FAILURE_CONDITION_LEVEL is set to 3, but AlwaysOn health detection will not trigger a response for this type of health issue unless the FAILURE_CONDITION_LEVEL for the availability group is set to 5.
For more information on the different SQL Server internal health states that the FAILURE_CONDITION_LEVEL property can be configured for, see the MSDN content:
Flexible Failover Policy for Automatic Failover of an Availability Group (SQL Server)
Mitigation
Address the SQL Server health issue that has been identified using the cluster diagnostic logs..
Diagnose SQL Server does not respond within HEALTH_CHECK_TIMEOUT (FAILURE_CONDITION_LEVEL 2 - 5)
AlwaysOn health detection uses the availability group HEALTH_CHECK_TIMEOUT to define how long to wait to get a response from SQL Server. If SQL Server does not respond with the results from executing sp_server_diagnostic within the HEALTH_CHECK_TIMEOUT (default is 30 sec), then the availability group will transition to RESOLVING state and failover if configured to do so.
The availability group HEALTH_CHECK_TIMEOUT setting is only utilized to trigger a response when FAILURE_CONDITION_LEVEL is set to 2-5. For more information on the FAILURE_CONDITION_LEVEL settings and which will trigger availability group state change, see:
Flexible Failover Policy for Automatic Failover of an Availability Group (SQL Server)
Example Review Cluster log
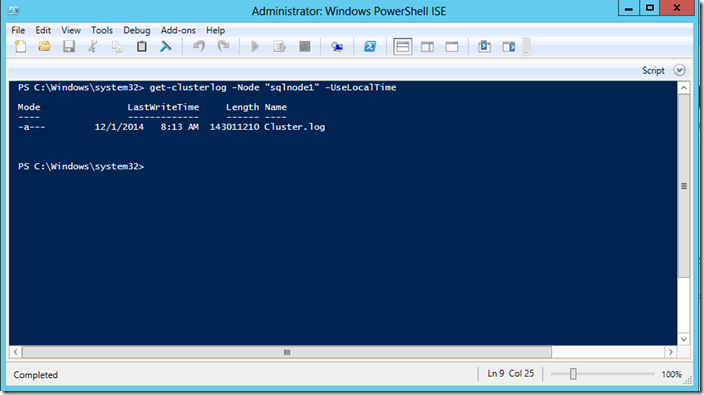
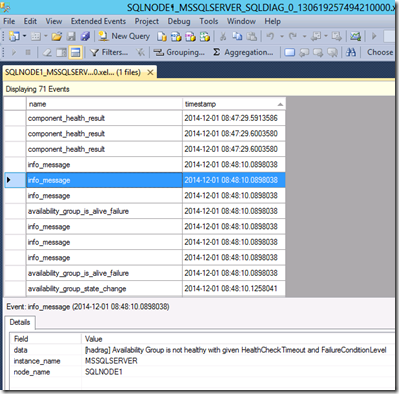
To check if a health check timeout has been violated, review the cluster log. Launch PowerShell with elevated privileges and execute 'Get-ClusterLog.'
Note the '...is not healthy with given HealthCheckTimeout' error message.
This is also logged in the Cluster Diagnostic Logs (SRVNAME_SQLINSTANCE_SQLDIAG_XXX.XEL) located in the SQL Server \LOG subdirectory in the event that the Cluster log is no longer available.
- Launch SQL Server Management Studio.
- From the File menu choose Open and then Merge Extended Event Files. Click the Add button in the dialog that appears.
- Drill into the SQL Server \LOG folder and shift+click to select each of the cluster diagnostic logs and click Open.
- Once the events have completed loading, click the timestamp column to order the events ascending by time.
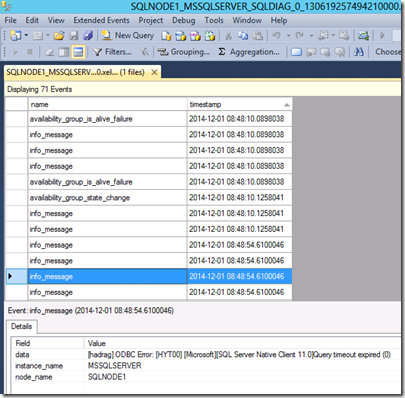
- Locate the time that the availability group was found to have transitioned to the RESOLVING state, or failed over and look for 'availability_group_is_alive_failure' events. Locate any 'info_message' events nearby. Review the Data column of each info_message event for additional explanation. Finding one that states 'Availability group is not healthy given HealthCheckTimeout and FailureConditionLevel' suggests the failure could be caused by HealthCheckTimeout.
- Look at the additional info_message events. One that reports QueryTimeoutExpired confirms that the HEALTH_CHECK_TIMEOUT was violated.
 |
 |
Mitigation
For temporary relief adjust the availability group HEALTH_CHECK_TIMEOUT value higher. Correct the health issue in SQL Server or the system that is impacting its responsiveness to the health check connection.
AVAILABILITY GROUP AG1 SET (HEALTH_CHECK_TIMEOUT = 40000);
Comments
Anonymous
June 02, 2015
I have used sp_cycle_errorlog twice in 2 months and after that automatic failover and failback has occured with the Lease timeout error. Prior to that lease timeout error has never surfaced. Want to know if this sp is causing the lease timeout issue. Kindly help. Thank in advance.- Anonymous
May 04, 2017
Hi Saumen,No issue with sp_cycle_errorlog..Its clearly explained above.
- Anonymous
Anonymous
November 10, 2015
best article i have ever read on msdnAnonymous
November 29, 2017
The comment has been removed- Anonymous
February 01, 2018
Same here, there isnt a properties tab anymore with the lease timeout available. - Anonymous
January 23, 2019
Once you click on Role in the middle tab, then click resources in the bottom tab select you AG and right click go to property.Parvinder
- Anonymous
