SharePoint Performance Issue
Daily we are receiving dozens of cases about SharePoint performance being slow. Honestly, some of these cases can hardly be resolved, e.g. our SharePoint page loads in 6 seconds, and we want it to load in 3 seconds, or it used to load in 3 seconds, but not anymore :). Firstly, I would like to highlight that the performance issue is always relative. Maybe someone feels that 6 seconds are not acceptable for a page to be loaded; whilst i see this is totally fine with the amount of customizations that they have. In fact, your SharePoint sites load time, or SharePoint servers resources utilization(RAM/CPU/Network) totally depends on many factors, some of them are the below:
- The customizations that you have in your SharePoint sites/farm.
- The amount of concurrent users that are accessing your SharePoint sites.
- The amount of data that you have on your SharePoint sites, and how this data is structured.
- The number of your SharePoint servers (WFE/Application), and SQL servers.
- The resources that you have for your servers(RAM/CPU/Disk/Network).
Based on the above, there are millions of reasons behind SharePoint performance issues. However, some of these reasons are very common and this is what i am going to highlight here in this blog, although it's frankly hard :), but let's see how the blog will end.
Common Root Causes:
SharePoint 2010 Usage Files
- Issue:
- We have a known issue for SharePoint 2010 that the usage files are not deleted which is making the timer job “Microsoft SharePoint Foundation Usage Data Import” never completes. This issue is shipped with the below symptoms:
- Missing or incomplete Web Analytics data
- The “Timer Service Recycle” timer job is never able to actually restart the timer service. It tries to pause the Usage Data Import job and cannot, so after ten minutes it skips the recycle.
- Memory bloat (leak) within owstimer.exe. You may see the timer service consume much more memory than normal. Restarting the timer service will bring it back to normal, but it will build up again over time.
- The "Diagnostic Data Provider: Trace Log" timer job intermittently does not import the ULS log data into the Logging database.
- Solution:
- Issue:
The fix is in the December 2013 Cumulative Update for SharePoint 2010.
Anti-Virus
- Issue:
- Whatsoever the antivirus that you are using on your SharePoint servers, it has to exclude some directories for SharePoint's sake. Ignoring this fact will cause a tremendous performance issue for your SharePoint site loading time, and in some cases unexpected behaviors! Talking here about the antivirus that is installed on the OS level.
- Solution:
- Based on the installed SharePoint version there is a list with the required paths. For the complete list, please check this article.
- To be Noted:
- Take into consideration that if you have SharePoint server, you will need to add the directories for both SharePoint Server, and SharePoint Foundation. For instance, for SharePoint Server 2013, add the paths for SharePoint Foundation 2013 and SharePoint Server 2013.
- The directories should be excluded along with their sub-directories.
- For the path "C:\Users\ServiceAccount\AppData\Local\Temp\", this is not a path, rather you have to change the highlighted word ServiceAccount with your SharePoint service accounts, and application pool accounts. For instance, the below are excluded on my SharePoint lab.
- C:\Users\spfarm\AppData\Local\Temp\
- C:\Users\Default_AppPool\AppData\Local\Temp\
- C:\Users\Default_sa_AppPool\AppData\Local\Temp\
- Important! If your SharePoint servers are virtual machines, add the directories on both the hosting machines, and the SharePoint servers. Whereas, I saw in some cases the antivirus which is installed on the hosting machine is causing troubles to the SharePoint servers which they are hosting. (strange but true!).
- Issue:
SCOM APM
- Issue:
- Many customers come with a severe performance issue on their SharePoint servers, and after investigating their issues, we notice that they have SCOM APM installed which is not supported.
- In fact, there are several articles talking about this issue with detailed analysis, and one of them is Bugras' which can be found here along with other articles that can be found below:
- Solution:
- Uninstall the Operations Manager monitoring agent
- Restart the computer to completely unload all .dll files.
-
Reinstall the Operations Manager agent without APM. To do this, run the following command:
msiexec /i MonAgent.msi NOAPM=1Note The NOAPM=1 parameter causes the Operations Manager agent to be installed without the .NET Framework application performance monitoring.
- Issue:
Security Token Service Causing high CPU Utilization
More information can be found here.
Network Issue
- Issue:
- Many performance issues are caused by having a non consistent network latency. Based on your network status your performance issue may become severe (getting SharePoint errors with correlations because of timeout errors to SQL), or only taking longer time than normal to load any SharePoint page.
- Solution:
- For your SharePoint farm to work properly you have to ensure having a consistent (no timeouts!) intra-farm latency ( < 1 ms). Specifically, there should be a highly consistent intra-farm latency of <1ms (one way from SharePoint servers to SQL servers), 99.9% of the time over a period of ten minutes.
- How to figure this out, or identify this issue? - This can easily be done by using PING as shown below:
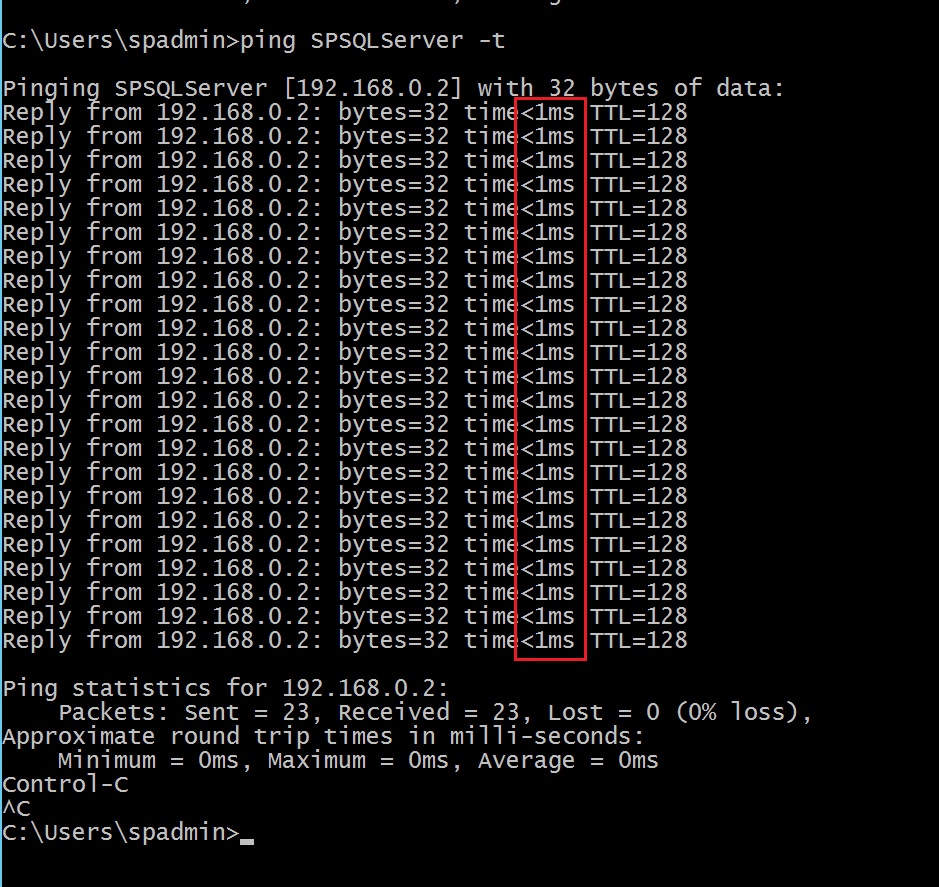
- As shown from the above, the response is always <1ms and we don't have any timeouts which is what SharePoint loves :).
- Reference: https://technet.microsoft.com/en-gb/library/cc748824.aspx#Anchor_6
- Issue:
Servers' Specifications
- You always have to check firstly if your SharePoint servers have the minimum required resources (RAM/Network/CPU), or not. You can verify this using the below links:
- SharePoint Server 2010 Hardware Requirements: https://technet.microsoft.com/en-us/library/cc262485(v=office.14).aspx
- SharePoint Server 2013 Hardware Requirements: https://technet.microsoft.com/library/a88d3f72-7ac3-4f08-b302-c4ca0a796268(v=office.16).aspx
- SharePoint Server 2016 Hardware Requirements: https://technet.microsoft.com/en-us/library/cc262485(v=office.16).aspx
- Certainly, you have Search Service Application, right? - If so, then please have a look on the Search hardware requirements:
- SharePoint 2013 Search Hardware Requirements: https://technet.microsoft.com/en-us/library/dn342836.aspx
- SharePoint 2016 Search Hardware Requirements: https://technet.microsoft.com/en-us/library/dn342836(v=office.16).aspx
- You always have to check firstly if your SharePoint servers have the minimum required resources (RAM/Network/CPU), or not. You can verify this using the below links:
SharePoint Version Supportability
In fact, this solution is not resolving the performance issue for most of the cases, but it's worth mentioning. Normally, our updates are shipped not only with new features, and fixes, but also with performance enhancements. Hence, it's always recommended to check and ensure that your SharePoint farm version has the least supported version. To get more information about this topic, and to know whether your farm is supported or not, please check this article. If installing the updates won't fix your performance issue, maybe restarting the servers or running the SharePoint Products Configuration wizard, as a part of the SharePoint patches installation, will :).
SharePoint SQL Databases Outdated Statistics
- Issue:
- When database statistics become outdated, SharePoint Server installations may experience one or more of the following symptoms:
Slow load times and decreased performance that may generate an HTTP 500 error when you open a site page.
Slower performance that generates error messages such as the following:
 Service unavailable
Unknown SQL Exception 53
Server Error in '/' Application Runtime ErrorPerforming search crawls causes unexpected SQL Server performance, database locking, and blocking.
Long-running timer jobs such as the "Microsoft SharePoint Foundation Usage Data Processing" jobs that take progressively longer to finish during each iteration.
The inability to open a SharePoint site, and an error message that resembles the following:
Unexpected System.Web.HttpException: Request timed outSite rendering time-outs when you load navigation, and the following error message:
PortalSiteMapProvider was unable to fetch children for nodeHigh CPU usage on the server that's running SQL Server when it processes SharePoint queries.
- When database statistics become outdated, SharePoint Server installations may experience one or more of the following symptoms:
- Solution:
- Although SharePoint 2010 and going forward has timer job for updating Index statistics; however, in some circumstances, we noticed that the timer job is not always successfully updating the statistics. For more information about this, check this article https://blogs.msdn.microsoft.com/erica/2012/10/31/sharepoint-and-database-statistics-why-are-they-out-of-date-and-what-to-do-about-it/
- Therefore, we recommend updating the SharePoint content database statistics daily using the
FULLSCANoption from SQL Server. Although SharePoint does have a timer job to update statistics by callingproc_updatestatistics, we strongly recommend implementing a scheduled maintenance plan from SQL Server to ensure database statistics are reliably updated on a daily basis. - When implementing the SQL Server maintenance plan to update the statistics on your SharePoint databases, it is not required to disable the job from SharePoint. However, because these maintenance tasks perform similar functions from both locations, it is permissible to disable the timer job from the SharePoint farm.
- The timer job which updates the databases statistics relies beneath the health analyzer rule Databases used by SharePoint have outdated index statistics.
- Reference: https://support.microsoft.com/en-us/help/3103194/outdated-database-statistics-decrease-sharepoint-server-performance--c
- Issue:
Certificate Revocation List (CRL)
All the needed information can be found here https://support.microsoft.com/en-us/help/2625048/site-slowness-because-of-sharepoint-sts-certificate-crl-checking
Blob Cache
- In some cases, we noticed that the root cause of the performance issue is the blob cache being enabled! shouldn't enabling blob cache resolve performance issues ?!
- In fact, if you don't follow the blob cache best practices, then you may experience a performance issue.
- Make sure that you put the BLOB cache on a drive that has sufficient disk space available in which to store the cache.
- select a drive that will be used by as few processes as possible so that the BLOB cache process does not encounter conflicts when it tries to access the drive. If too many processes compete for disk access on the drive where the BLOB cache is located, BLOB cache performance and other processes will be adversely affected. For instance, don't keep the blob cache in the same drive as the SharePoint trace logs.
- If you plan to use the BLOB cache in a scenario with heavy cache use, such as serving videos in a high traffic environment, and if you will use ULS logging, consider placing the BLOB cache on a separate physical drive from the ULS log — not on a separate partition. Storing the BLOB cache and the ULS log on the same drive can result in poor server performance. If you place the BLOB cache and the ULS log on the same physical drive, make sure that you closely monitor the disk queue length for any performance effect.
- If you have anti-virus already installed on your SharePoint servers, ensure excluding the blob cache directory and all its subdirectories from the AV scanning.
- When you decide how large to make the BLOB cache, you must consider the number and size of the files to determine the total size of the data to be stored in the cache. By default, the BLOB cache is set to 10 gigabytes (GB). Allow at least 20 percent more space on the drive than the size of the cache. For example, if you have 100 GB of content, set the size of the cache to 120 GB on a drive that has at least 150 GB of space. If the BLOB cache is too small, serving files to users slows, reducing the performance of your site.
- If you plan to use the image renditions feature on your site, you should account for each rendition being a separate BLOB in the cache. For example, if you plan to have five renditions per image, then you must allocate significantly more than the general estimate of 20 percent more space on the drive.
- Reference: https://technet.microsoft.com/en-us/library/ee424404.aspx#Section1c
Not recommended SharePoint Data Structure/Configurations:
Verbose/VerboseEx Logging
- Issue:
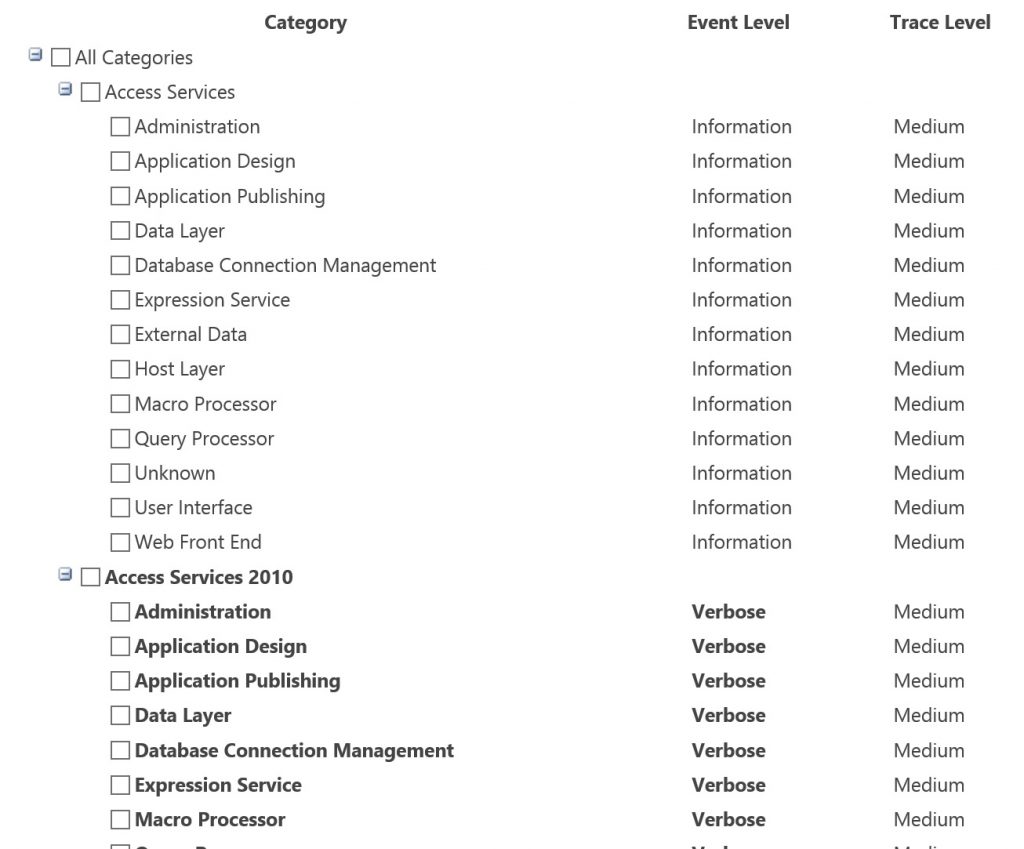
- Normally, you should not keep SharePoint Verbose logging, or VerboseEx logging enabled for long time, rather only to investigate a certain issue and to set it back to default right after. Whereas, Verbose/VerboseEx logging can quickly use drive space and affect drive and server performance.
- You can verify the SharePoint log level from SharePoint Central Administration and via Monitoring >> Configure Diagnostic Logging. If the log categories are not in bold, then the log level is set to default, as shown below:
- Solution
Just set the SharePoint log level back to default. Simply, you can do this either via Central Administration or by running the below command via SharePoint management shell.
-
Clear-SPLogLevel It's worth mentioning that if you have a custom logging category from your dev team, ensure that the default log level is not Verbose :)
- Issue:
Debug=true and Web Application Batch Compilation
- Issue:
- ASP.NET supports compiling applications in a special debug mode that facilitates developer troubleshooting. Debug mode causes ASP.NET to compile applications with extra information that enables a debugger to closely monitor and control the execution of an application.
- Applications that are compiled in debug mode execute as expected. However, the performance of the application is affected. To avoid the effect on performance, it is a good idea to enable debugging only when a developer is doing interactive troubleshooting. By default, debugging is disabled.
- How to verify if the web application debugging is enabled or not?
Open IIS Manager, and allocate your SharePoint site.
Access the site web.config file.
Check the value of the attributes debug andbatchwhich should have false value in order to avoid any performance issue. In other words, the web.config should contain the below tag.
-
<compilation batch="false" debug="false">
- Solution:
Disable the SharePoint web application debugging by having the below tag in the web application web.config
-
<compilation batch="false" debug="false"> More information can be found here https://blogs.technet.microsoft.com/stefan_gossner/2012/07/20/sharepoint-memory-leak-caused-by-incorrect-web-config-settings/
- Issue:
Audit Logs
- Issue
- I saw cases where customers enabled SharePoint Audit Logging without configuring automatic trimming which will make the Audit Logs increase dramatically without being monitored and will certainly eventually cause a site performance issue.
- We recommend that you only select Opening or downloading documents, viewing items in lists, or viewing item properties for SharePoint sites when absolutely needed. This option is likely to generate a large number of events that will potentially degrading the performance and other aspects of the site collection.
- How to determine the current number of Audit Log records that you have? - This can be achieved by any of the below methods
- If your site audit log records exceeds 5 Million records, then your users may experience performance issue when accessing this site.
- Reference: https://support.office.com/en-us/article/Configure-audit-settings-for-a-site-collection-f5a346d0-ee0f-4412-a5e6-d9b5abaa1012
- Solution:
- If you are in this situation, you will need to enable Audit Log Trimming from the site collection settings page, and specify number of days to retain these logs. Hereafter, you will need to run the timer job "Audit Log Trimming" for your web application.
- As the timer job "Audit Log Trimming" is by default scheduled to run monthly, I would recommend also scheduling it to run Daily or Weekly. Whereas, this can be achived as follows:
- Issue
Large Lists/Libraries
- Issue
- Do you have large lists/libraries in your farm? By large lists/libraries, we mean a list/library that has about 5,000 items or more. Yes, in our SharePoint boundaries and limits article we state that a single SharePoint list/library can hold up to 30 Million items/documents; however, this is a conditional supported number!
- If you are really going to have a list/library that has more than 5,000 items/documents, then you have to structure your list/library in order not to query the SQL server with more than 5,000 items/documents, unless you keep the default list/library throttling values.
- So, why only 5,000 although the list/library can support up to 30 Million?
- To minimize database contention SQL Server, the back-end database for SharePoint, often uses row-level locking as a strategy to ensure accurate updates without adversely impacting other users who are accessing other rows. However, if a read or write database operation, such as a query, causes more than 5,000 rows to be locked at once, then it's more efficient for SQL Server to temporarily lock the entire table until the database operation is completed.
- Issue
Note: The actual number is not always 5,000, and can vary depending on your site, the amount of activity in the database, and your site's configuration.
-
-
-
- When the whole table is locked, it prevents other users from accessing the table. If this happens too often, then users will experience a degradation of system performance. Therefore, throttling and limits are essential to help minimize the impact of resource-intensive database operations and balance the needs of all users.
- Event worse, this won't only impact this site collection, but all the site collections contained in the same content databases, as all the site collections inside a content database share the same items/documents tables.
-
-
Reference: https://support.office.com/en-us/article/Manage-large-lists-and-libraries-in-SharePoint-b8588dae-9387-48c2-9248-c24122f07c59
-
- Solution
- The solution here, in order to avoid encountering a performance issue due to large lists/libraries, is to ensure creating the items/documents inside folders; whereas, each folder should contain at most 5,000 items/documents. By doing so, we will be sure that SharePoint will never sent a SQL query with 5,000+ items/documents results.
- Furthermore, ensure not using or creating any view that will retrieve more than 5,000 items/documents.
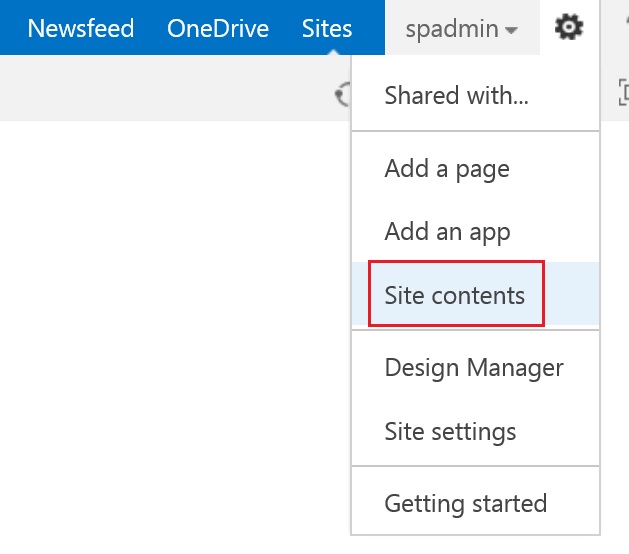
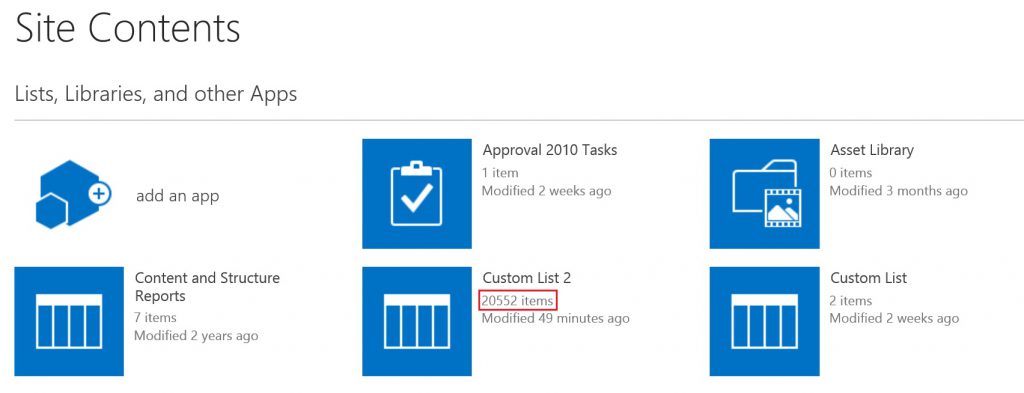
- How to detect the large lists/libraries in your site?
- Solution
List/Library Throttling
Issue
-
- Whether you disabled the list view throttling intentionally or unintentionally (your dev team did), you have to know that SharePoint throttling is enabled by default for a valid reason and to save your back when a user is heavily using a list/library which eventually will impact all the users that are using this site collection and all the site collections included in the same content database.
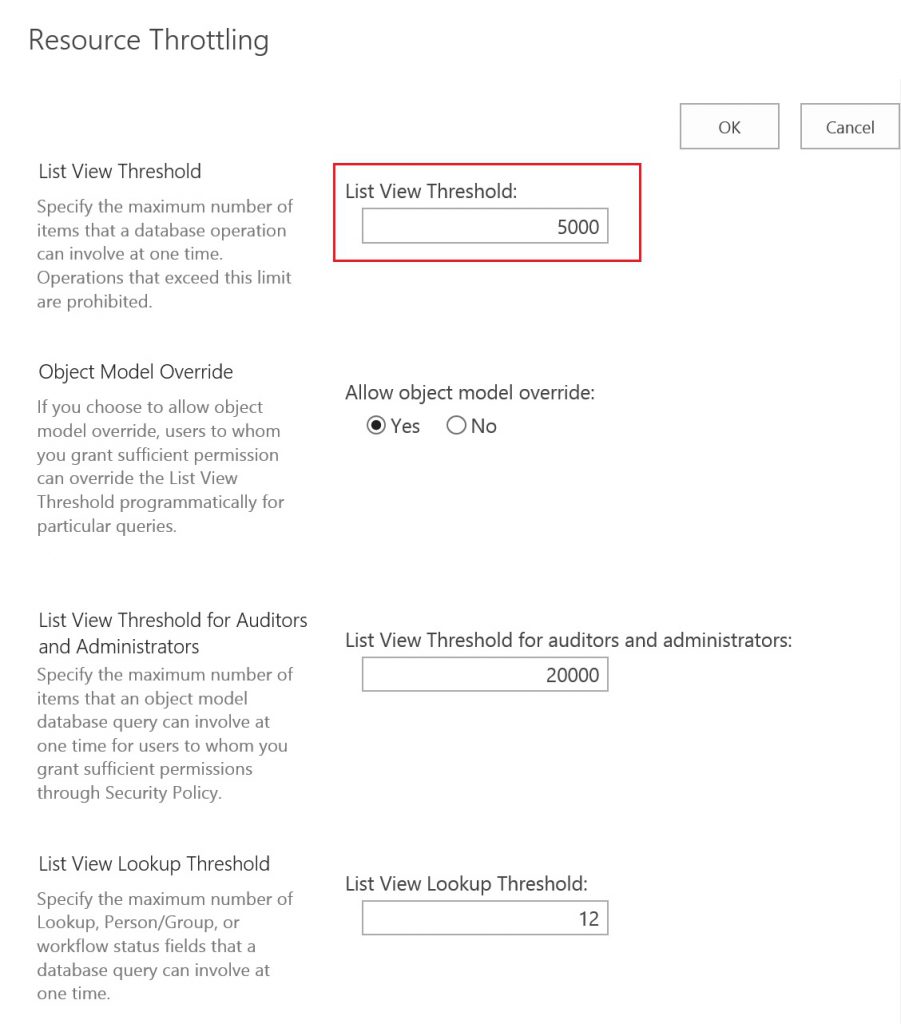
- As demonstrated in the Large Lists/Libraries section, if a read or write database operation, such as a query, causes more than 5,000 rows to be locked at once, then it's more efficient for SQL Server to temporarily lock the entire table until the database operation is completed, and that's why we have the view throttling configuring with 5,000 items.
- Is my web application configured with list view throttling equals 5,000? - This can be known via Central Administration site >> Application Management >> Manage Web Applications, then select your web application and from the Ribbon choose General Settings >> Resource Throttling.
- In fact, the web application throttling is not the only place to configure throttling; whereas, lists/libraries can be configured using PowerShell. So, how to determine the lists/libraries that have throttling disabled?!
- Using the below code should do the trick for you.
Add-PSSnapin Microsoft.SharePoint.PowerShell -ErrorAction SilentlyContinue $webApplicationURL = Read-Host "Enter Web Application URL" $reportPath = Read-Host "Enter full Path URL in the format (d:\temp\throttledLists.txt)" $webapplication = Get-SPWebApplication $webApplicationURL $sites = $webapplication.Sites Write-Output "List URL" | Out-File $reportPath foreach($site in $sites) { $webs = $site.AllWebs foreach($web in $webs) { $lists = $web.Lists foreach($list in $lists) { if(-not $list.EnableThrottling) { $listUrl = "$($web.Url)$($list.DefaultViewUrl)" Write-Host $listUrl -ForegroundColor Red Write-Output $listUrl | Out-File $reportPath -append } } $web.Dispose() } $site.Dispose() } Write-Host "Script is completed successfully!" -ForegroundColor Green-
Solutio
- Just keep the web application throttling values as they are :).
Workflow Tasks/History Lists
- Issue:
- SharePoint workflow tasks list, and history list can grow indefinitely which is going to cause a performance issue in your site. Here it comes our default enabled timer job "Workflow Auto Cleanup" which runs to delete the old workflow tasks, and workflow instances.
- However, if you disable this timer job, or increase your workflow retention from 60 days, then you will have to keep an eye on your tasks list.
- Workflow Tasks list, and History list are normal lists at the end; so, they should not contain much items there.
- Solution:
- Do not disable the timer job "Workflow Auto Cleanup". If you have to disable it, keep an eye on your workflow Tasks list, and ensure that you have an archival system on it.
- Reference: https://technet.microsoft.com/en-us/library/ee662522(v=office.14).aspx
- Ensure using a separate workflow Tasks list, and History list for each workflow association.
- More information can be found here https://blogs.msdn.microsoft.com/ahmedamin/2017/10/01/sharepoint-workflow-auto-cleanup/
- Issue:
Unique Granted Permissions(ACL)
Issue:
We have two configurations/limits here, as follows:
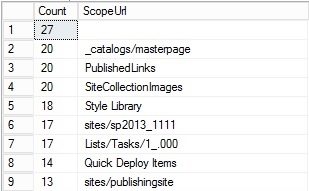
Security scope 50,000 per list Threshold The maximum number of unique security scopes set for a list cannot exceed 50,000.For most farms, we recommend that you consider lowering this limit to 5,000 unique scopes. For large lists, consider using a design that uses as few unique permissions as possible.When the number of unique security scopes for a list exceeds the value of the list view threshold (set by default at 5,000 list items), additional SQL Server round trips take place when the list is viewed, which can adversely affect list view performance.A scope is the security boundary for a securable object and any of its children that do not have a separate security boundary defined. A scope contains an Access Control List (ACL), but unlike NTFS ACLs, a scope can include security principals that are specific to SharePoint Server 2013. The members of an ACL for a scope can include Windows users, user accounts other than Windows users (such as forms-based accounts), Active Directory groups, or SharePoint groups. Security principal: size of the Security Scope 5,000 per Access Control List (ACL) Supported The size of the scope affects the data that is used for a security check calculation. This calculation occurs every time that the scope changes. There is no hard limit, but the bigger the scope, the longer the calculation takes. Hence, in order to identify the security scopes which are big already, you can run the below SQL query. However, as we in MS don't recommend running SQL queries, and i personally hate doing so, i would recommend taking a backup from your content database, restore it on another SQL server, and then run the below SQL query.
-
 select COUNT(ra.PrincipalId) as [Count],p.ScopeUrl
from RoleAssignment ra with(nolock)
join Perms p with(nolock) on p.SiteId = ra.SiteId and p.ScopeId = ra.ScopeId
group by p.ScopeUrl
order by [Count] desc
Running the above query should display results, as shown below:
Solution:
- The solution here is easy, but hard to be implemented.
- Ensure not having many scope URLs. In other words, don't make many items have unique scopes. For instance, don't make each single item in a list has a unique scope. As doing so will eventually increase the number of unique scopes, and will eventually cause a severe performance issue.
- Try not granting permissions to individual users, rather to groups. Even better, use AD groups for granting permissions instead of SharePoint groups which may also contains so many users that will impact your site performance.
- More information can be found here on Bugra's article, although it's for SharePoint 2007, but the concept is similar.
- The solution here is easy, but hard to be implemented.
Custom Code
Information about coding best practices can be found here https://msdn.microsoft.com/en-us/library/bb687949(v=office.12).aspx
Comments
- Anonymous
December 14, 2017
Great article - Thanks for posting useful information. Here is some more information I wrote some time ago when working on the performance related issues. https://sharepointumar.wordpress.com/2014/03/15/improve-performance-share-point-project-server/


