练习 - 在云原生应用程序中使用 OpenTelemetry 数据
在本练习中,你将在你的应用中更好地了解 OpenTelemetry 生成的所有数据。 你将完成向 Store 服务添加诊断功能的过程。 完成该设置后,你将向 eShopLite 服务添加 Prometheus 和 Grafana,并查看正在捕获的一些指标。 下一步是添加 Zipkin 并查看分布式跟踪。 最后,你将向应用添加 Application Insights,并使用它来查看数据。
添加 Prometheus 和 Grafana
Prometheus 和 Grafana 提供 Docker 映像,以便轻松地将它们添加到你的项目。 你将它们包含在位于解决方案根目录中的 docker-compose.yml 文件中。
在 Visual Studio Code 的“资源管理器”窗格中,选择“docker-compose.yml”文件。
将此 YAML 添加到文件底部:
  prometheus:
    image: prom/prometheus
    container_name: prometheus
    command:
      - '--config.file=/etc/prometheus/prometheus.yml'
    ports:
      - 9090:9090
    restart: unless-stopped
    volumes:
      - ./prometheus:/etc/prometheus

  grafana:
    image: grafana/grafana
    container_name: grafana
    ports:
      - 3000:3000
    restart: unless-stopped
    environment:
      - GF_SECURITY_ADMIN_USER=admin
      - GF_SECURITY_ADMIN_PASSWORD=grafana
    volumes:
      - ./grafana/datasource:/etc/grafana/provisioning/datasources
前面的 Docker yaml 添加了两个新服务:Prometheus 和 Grafana。 Prometheus 部分配置了一个容器以在端口 9090 上响应。 它映射了需要 prometheus.yml 文件的 prometheus 文件夹。 Grafana 部分配置了一个容器以在端口 3000 上响应。 它映射了 grafana 文件夹中的三个文件夹。
配置 Prometheus
需要配置 Prometheus,以便它知道在何处收集指标。 将 prometheus.yml 文件添加到 prometheus 文件夹。
在 Visual Studio Code 的“资源管理器”窗格中,右键单击“dotnet-observability”文件夹,然后选择“新建文件夹”。
在名称字段中,输入 prometheus。
在“资源管理器”窗格中,右键单击“prometheus”文件夹,然后选择“新建文件”。
在名称字段中,输入 prometheus.yml。
在文件编辑器中,输入以下 YAML:
global:
  scrape_interval: 1s

scrape_configs:
  - job_name: 'products'
    static_configs:
      - targets: ['backend:8080']
  - job_name: 'store'
    static_configs:
      - targets: ['frontend:8080']
前面的 YAML 会将 Prometheus 配置为从后端和前端服务中抓取指标。 当应用在 Docker 中运行时,主机名是服务名。
按 Ctrl+S 保存文件。
配置 Grafana
需要配置 Grafana,以便它知道在何处收集指标。
在 Visual Studio Code 的“资源管理器”窗格中,右键单击“dotnet-observability”文件夹,然后选择“新建文件夹”。
在名称字段中,输入“grafana”。
右键单击“grafana”文件夹,然后选择“新建文件夹”。
在名称字段中,输入“datasource”。
右键单击“grafana”文件夹,然后选择“新建文件夹”。
在名称字段中,输入“dashboard”。
展开“grafana”文件夹,右键单击“datasource”文件夹,然后选择“新建文件”。
在名称字段中,输入“datasource.yml”。
在编辑器选项卡中,输入以下 YAML:
apiVersion: 1

datasources:
- name: Prometheus
  type: prometheus
  url: http://prometheus:9090
  isDefault: true
  access: proxy
  editable: true
上述 YAML 会将 Grafana 配置为使用 Prometheus 作为数据源。
按 Ctrl+S 保存文件。
更新你的 ASP.NET Core 应用以公开 Prometheus 的指标
现在,诊断项目仅配置为向控制台公开指标。 你将更新项目以改为向 Prometheus 公开指标。
在 Visual Studio Code 底部的“终端”窗格中,转到“诊断”文件夹。
运行以下命令:
cd .\eShopLite\Diagnostics\移除
OpenTelemetry.Exporter.Console包:dotnet remove package OpenTelemetry.Exporter.Console添加
OpenTelemetry.Exporter.Prometheus.AspNetCore包:dotnet add package OpenTelemetry.Exporter.Prometheus.AspNetCore --prerelease在“资源管理器”窗格中,展开“诊断”文件夹,然后选择“DiagnosticServiceCollectionExtensions.cs”。
将控制台导出程序
.AddConsoleExporter();替换为以下代码:.AddPrometheusExporter();在文件的底部,在最后一个
}之前,添加以下代码:public static void MapObservability(this IEndpointRouteBuilder routes) { routes.MapPrometheusScrapingEndpoint(); }此代码会将 Prometheus 抓取终结点添加到在应用中包含此功能的每个服务。 这会允许 Prometheus 从
http://service/metrics中抓取指标。按 Ctrl+S 保存文件。
在 Store 服务中公开指标
该应用当前仅配置为公开“产品”服务的指标。 你还将更新应用以公开 Store 服务的指标。
在“资源管理器”窗格中的“解决方案资源管理器”下,右键单击“Store”项目,然后选择“添加项目引用”。
选择“诊断”。
在“资源管理器”窗格中,展开“Store”文件夹,然后选择“Program.cs”。
在代码注释
// Add observability code here下,添加对 Diagnostics 方法的调用:builder.Services.AddObservability("Store", builder.Configuration);在
app.Run()方法之前,添加以下代码:app.MapObservability();此方法会将 Prometheus 抓取终结点添加到“Store”服务。
按 Ctrl+S 保存文件。
在“资源管理器”窗格中,展开“产品”文件夹,然后选择“Program.cs”。
在
app.Run()方法之前,添加以下代码:app.MapObservability();此方法会将 Prometheus 抓取终结点添加到“产品”服务。
按 Ctrl+S 保存文件。
测试新的可观测性功能
现在,你将测试已添加到应用的新的可观测性功能。
在底部的“终端”窗格中,转到 dotnet-observability/eShopLite 文件夹。
cd ..更新应用容器。
dotnet publish /p:PublishProfile=DefaultContainer转到 dotnet-observability 文件夹,并使用 Docker 启动应用:
cd ..
docker compose up
在“端口”选项卡中,选择“Prometheus (9090)”对应的“在浏览器中打开”。 如果在 Visual Studio Code 中本地运行,请打开浏览器,然后在新选项卡中转到 Prometheus 应用
http://localhost:9090。在顶部菜单中,依次选择“状态”和“目标”。
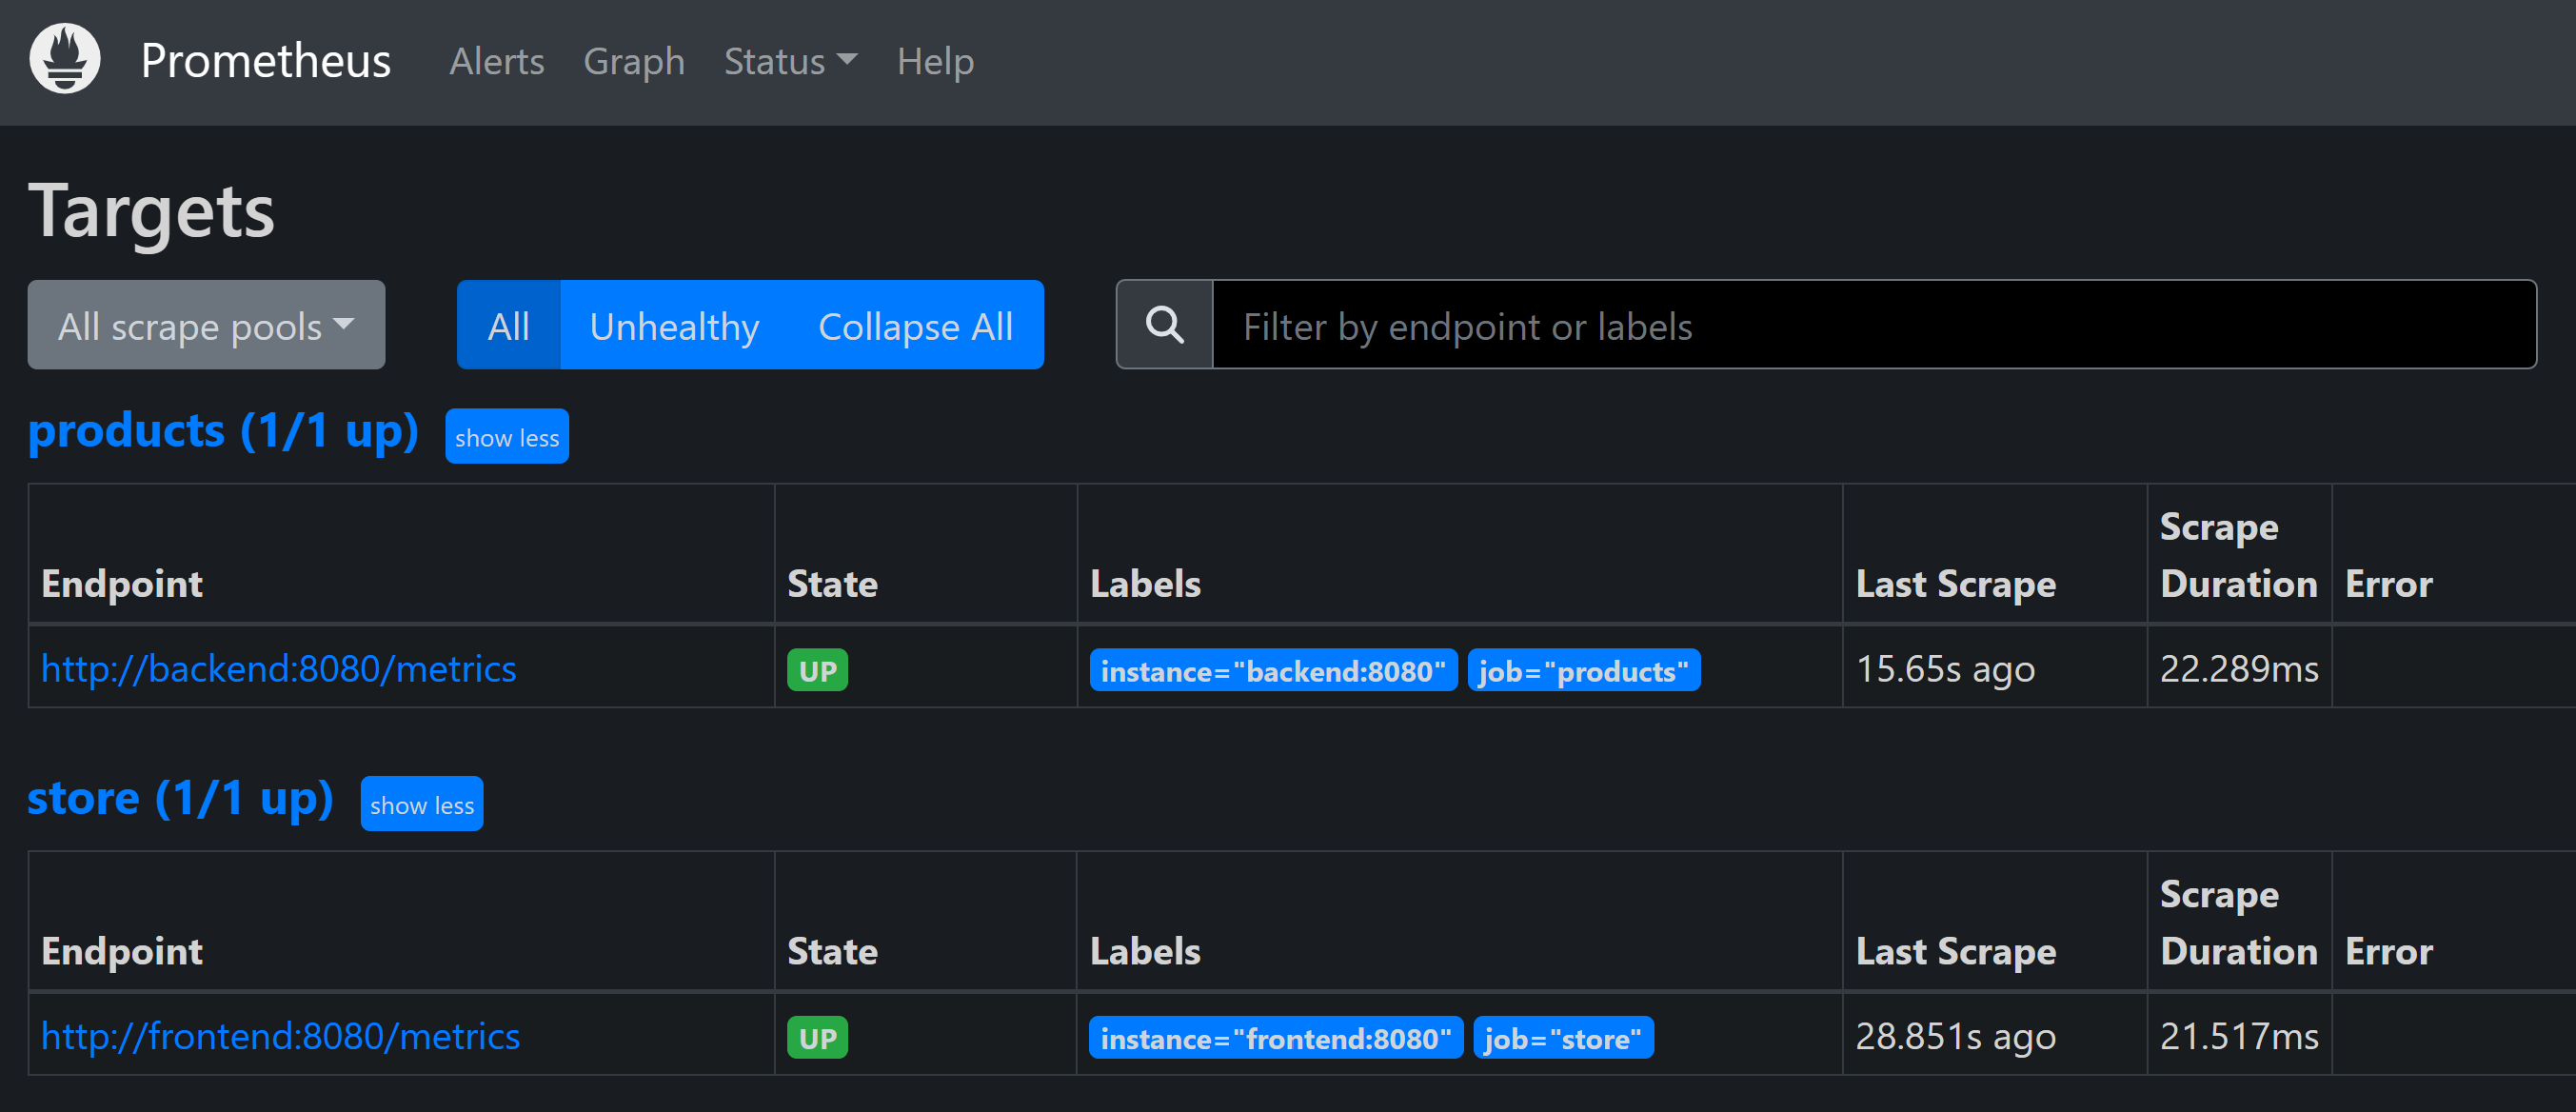
你应会看到“Products”和“Store”服务列为“UP”。
在“端口”选项卡中,选择“Grafana (3000)”对应的“在浏览器中打开”。 如果在 Visual Studio Code 中本地运行,请打开浏览器,然后在新选项卡中转到 Grafana 应用
http://localhost:3000。输入用户名“管理员”。
输入密码“grafana”。
选择“创建你的第一个仪表板”。
选择“导入仪表板”。
在新选项卡中,转到“GitHub”并打开“ASP.NET Core 仪表板 json”文件。
复制原始文件。
通过仪表板 JSON 模型文本框将 JSON 粘贴到“导入”。
选择“加载”。
在“Prometheus 数据源”下拉列表中,选择“Prometheus”。
选择“导入” 。
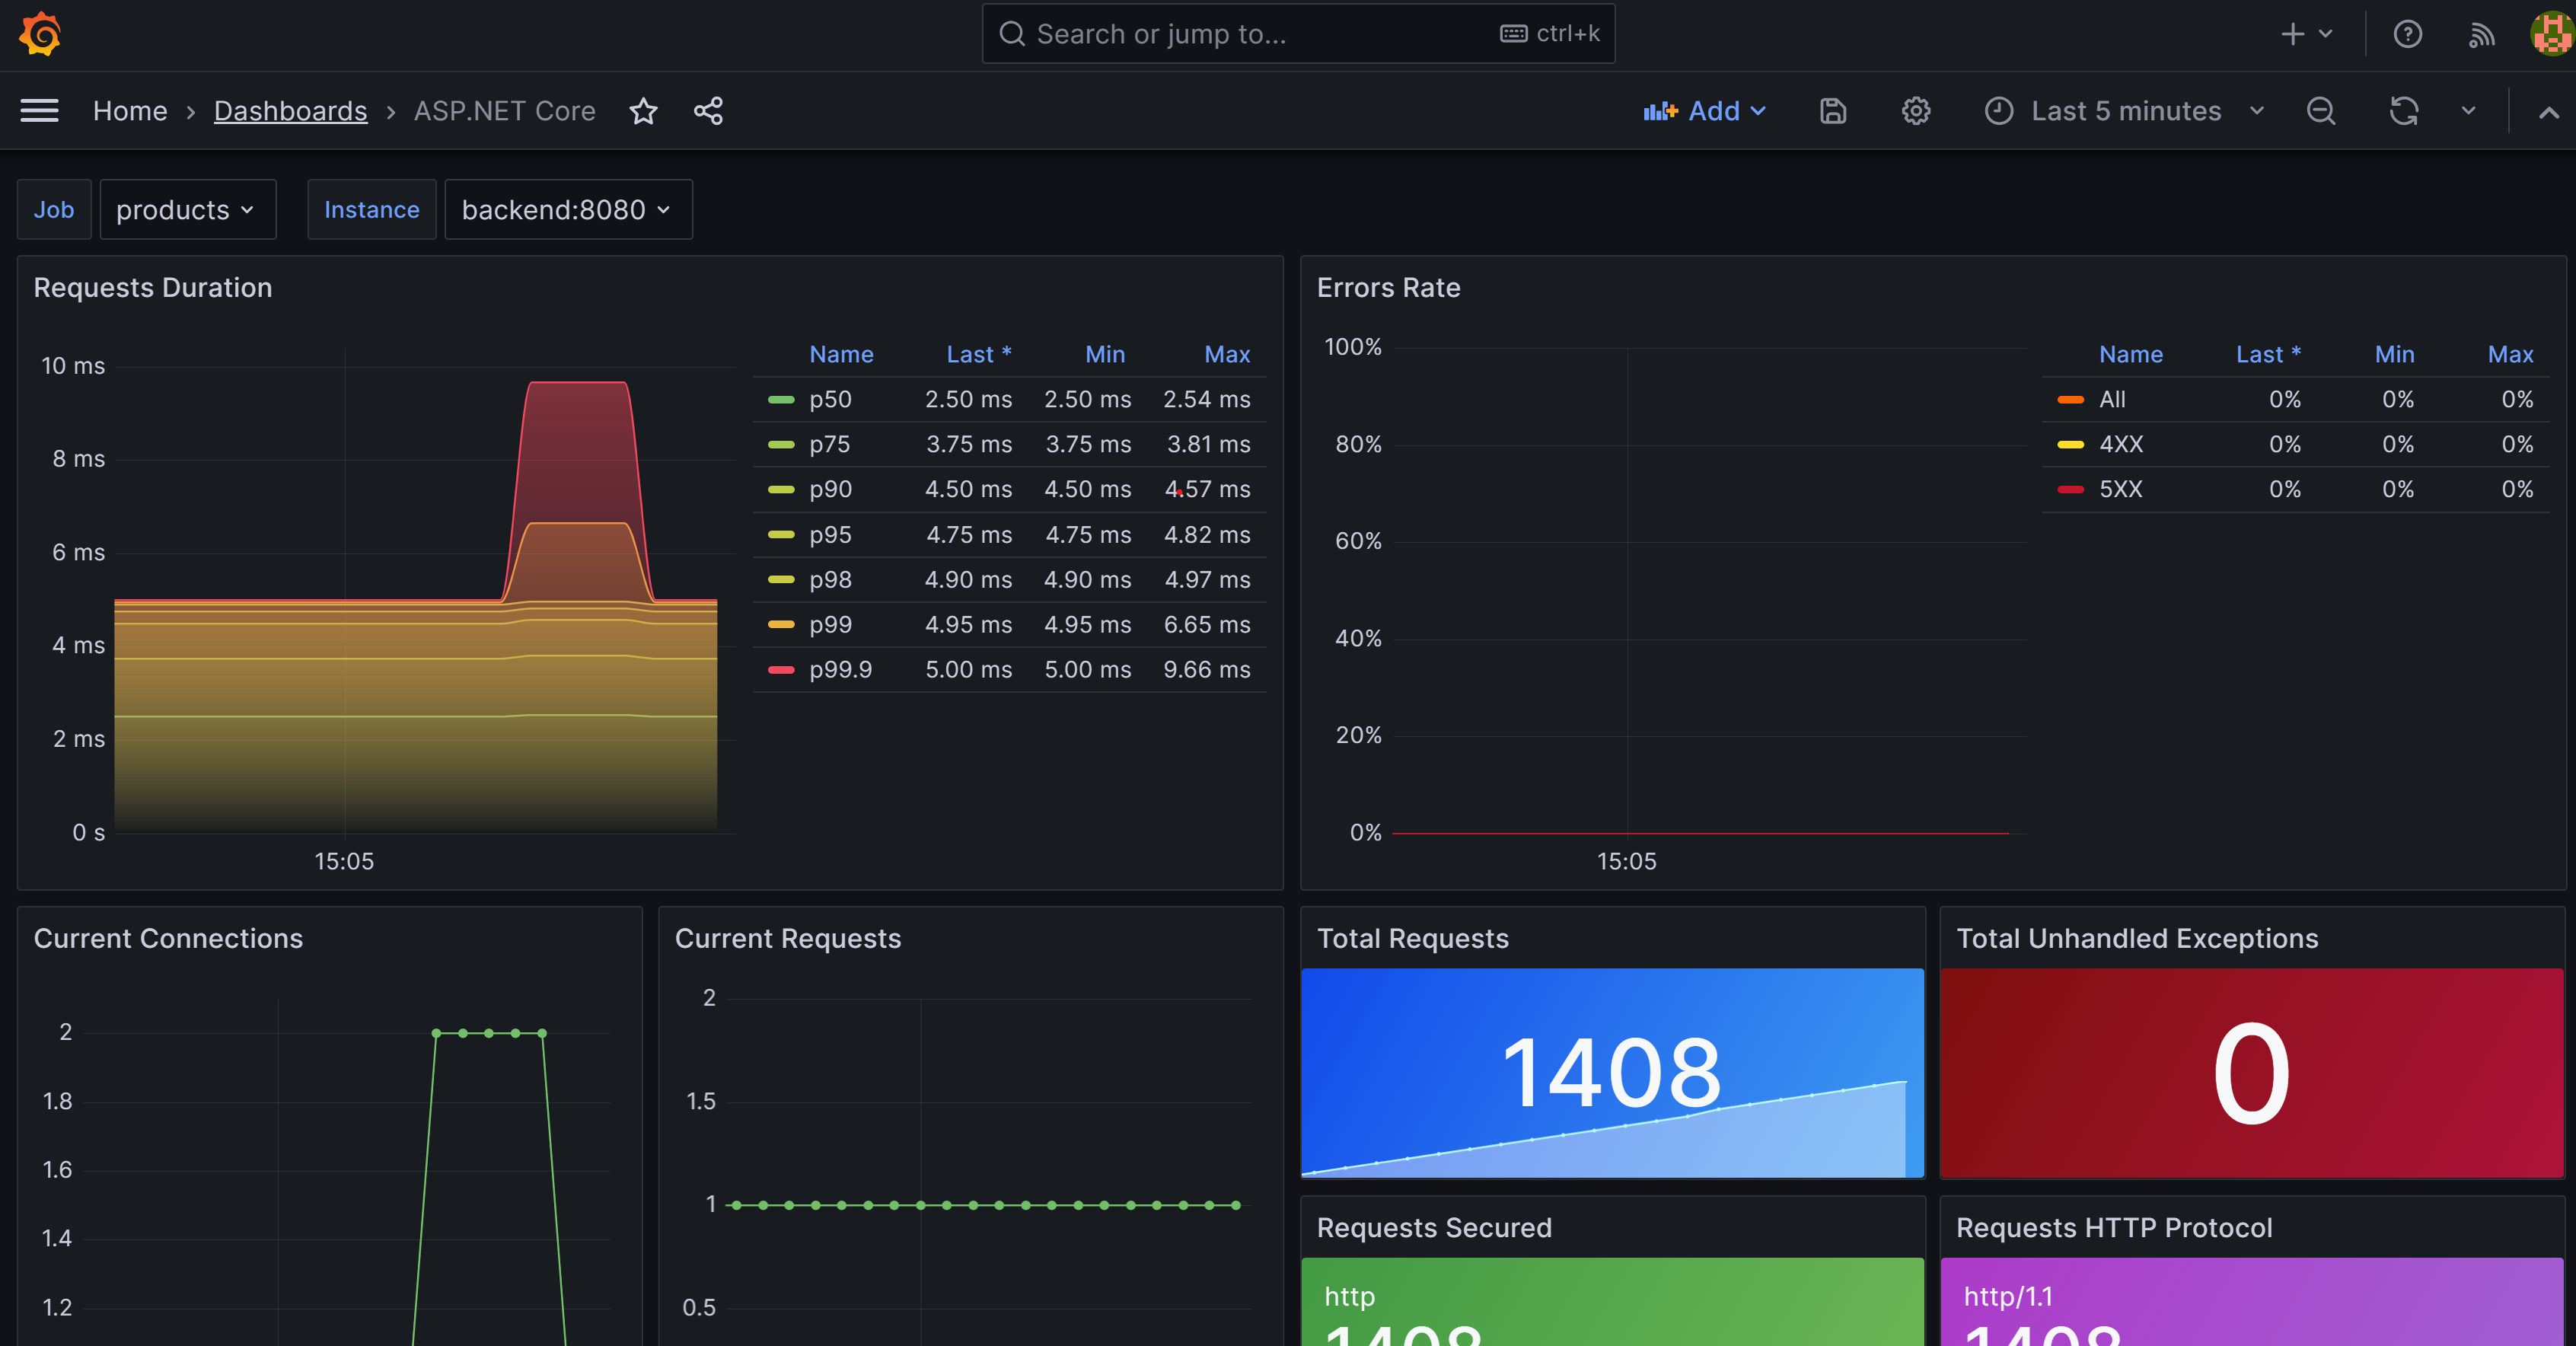
你应会看到一个仪表板,其中显示了“Products”和“Store”服务的指标。 选择要在两个服务之间更改的作业。
在“终端”窗格中,按 CTRL+C 停止应用。


添加 Zipkin
现在,你将通过添加 Zipkin 来扩展应用的跟踪功能。 与之前一样,你将向应用添加 Zipkin 容器,并将其配置为连接到 OpenTelemetry 收集器。 然后将 OpenTelemetry Zipkin 导出程序添加到应用。
在 Visual Studio Code 的“资源管理器”窗格中,选择“dotnet-observability”文件夹中的“docker-compose.yml”文件。
在
frontend的depends_on中添加prometheus和zipkin。depends_on: - backend - prometheus - zipkin在
backend的depends_on中添加prometheus。depends_on: - prometheus将 Zipkin 的环境变量同时添加到
frontend和backend:environment: - ZIPKIN_URL=http://zipkin:9411这两个服务应如下所示:
frontend:
  image: storeimage
  build:
    context: .
    dockerfile: ./eShopLite/Store/Dockerfile
  environment:
    - ProductEndpoint=http://backend:8080
    - ZIPKIN_URL=http://zipkin:9411
  ports:
    - "32000:8080"
  depends_on:
    - backend
    - prometheus
    - zipkin

backend:
  image: productservice
  build:
    context: .
    dockerfile: ./eShopLite/Products/Dockerfile
  environment:
    - ZIPKIN_URL=http://zipkin:9411

  ports:
    - "32001:8080"
  depends_on:
    - prometheus
将此 YAML 添加到文件底部:
  zipkin:
    image: openzipkin/zipkin
    ports:
      - 9411:9411
上述 YAML 会将 Zipkin 容器添加到应用。 它将 Zipkin 容器配置为在端口 9411 上做出响应。
按 Ctrl+S 保存文件。
在“终端”窗格中,转到“诊断”文件夹。
cd ./eShopLite/Diagnostics/添加 Zipkin 导出包。
dotnet add package OpenTelemetry.Exporter.Zipkin --prerelease在“资源管理器”窗格中,展开“诊断”文件夹,然后选择“DiagnosticServiceCollectionExtensions.cs”。
在跟踪提供程序的底部,添加 Zipkin:
// add the tracing providers
.WithTracing(tracing =>
{
  tracing.SetResourceBuilder(resource)
              .AddAspNetCoreInstrumentation()
              .AddHttpClientInstrumentation()
              .AddSqlClientInstrumentation()
              .AddZipkinExporter(zipkin =>
              {
                var zipkinUrl = configuration["ZIPKIN_URL"] ?? "http://zipkin:9411";
                zipkin.Endpoint = new Uri($"{zipkinUrl}/api/v2/spans");
              });
});
按 Ctrl+S 保存文件。
在底部的“终端”窗格中,转到 dotnet-observability/eShopLite 文件夹。
cd ..更新应用容器。
dotnet publish /p:PublishProfile=DefaultContainer转到 dotnet-observability 文件夹,并使用 Docker 启动应用:
cd ..
docker compose up
在“端口”选项卡中,选择“Prometheus (9090)”对应的“在浏览器中打开”。 如果在 Visual Studio Code 中在本地运行,请打开新的浏览器选项卡,然后转到 Zipkin 应用
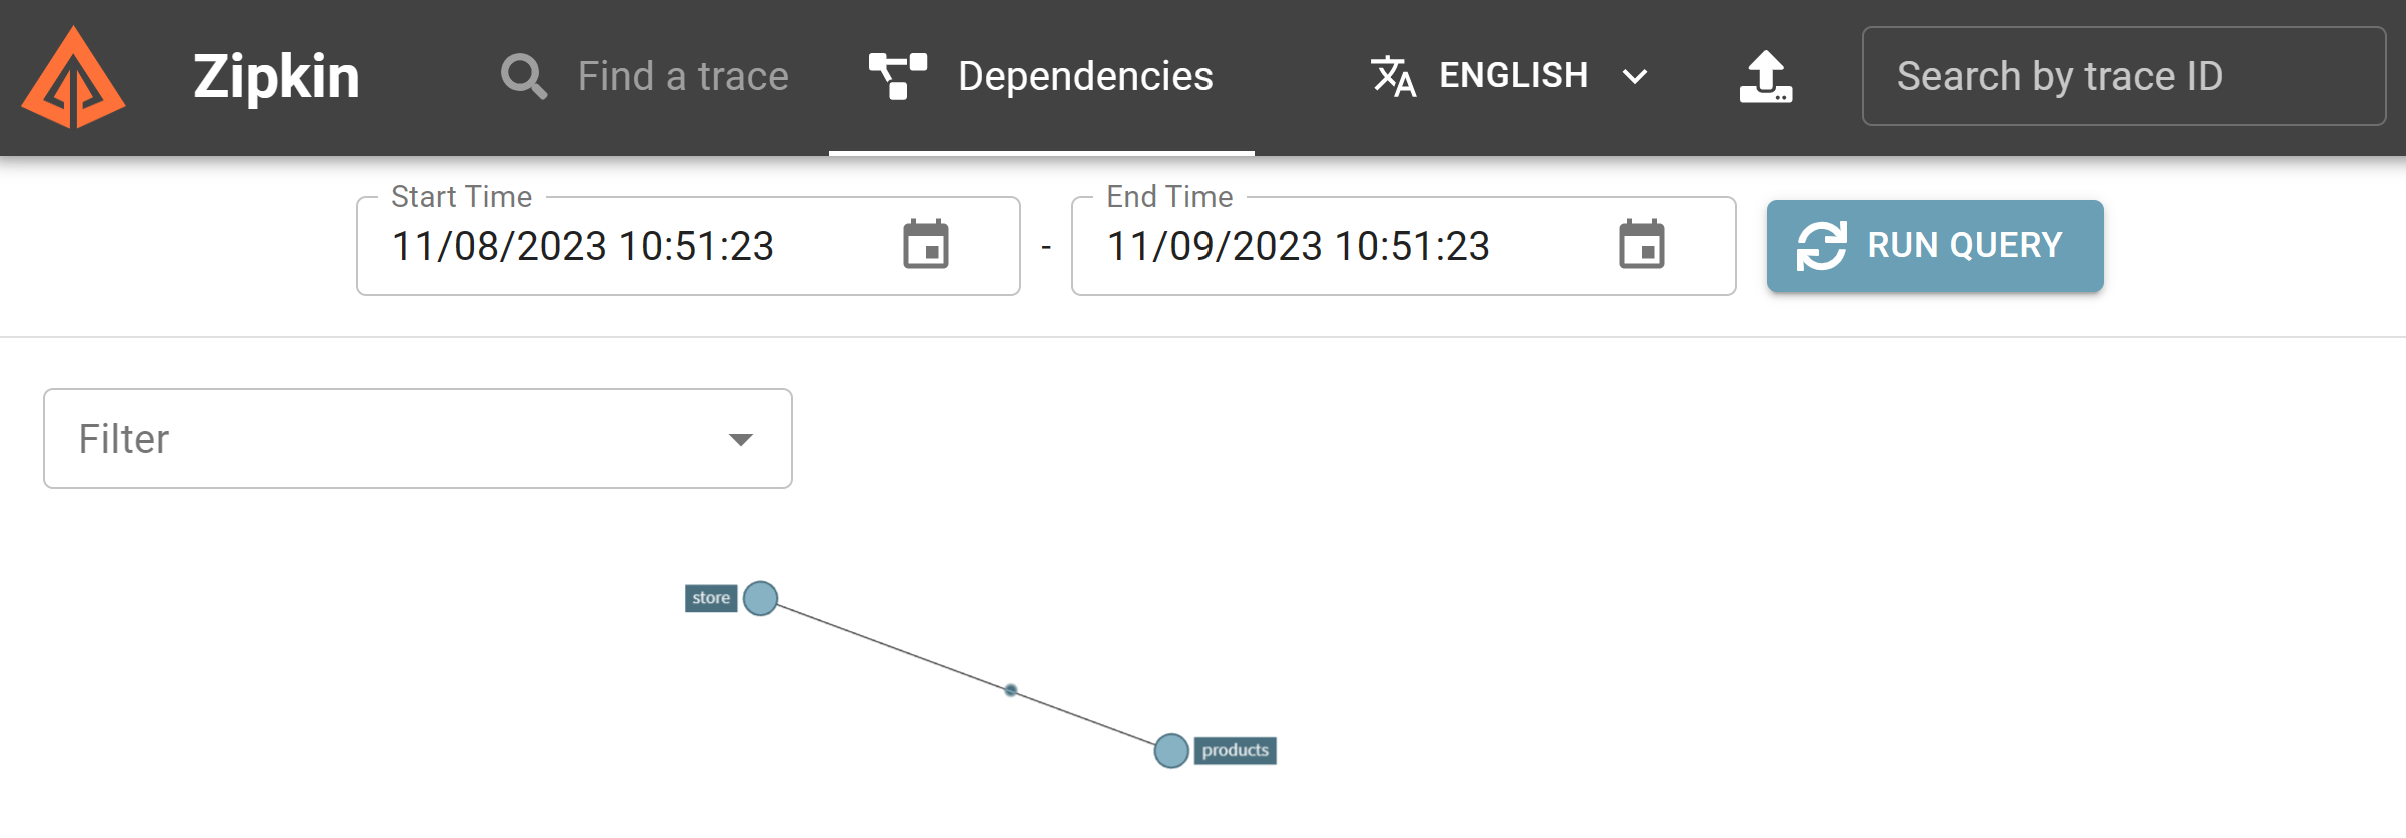
http://localhost:9411。在菜单中,选择“依赖项”。
在“终端”窗格中,按 CTRL+C 停止应用。
添加 Application Insights
最后一步是将 Application Insights 添加到你的应用。
在 Azure 中创建 Application Insights 资源
在 Visual Studio Code 的“终端”窗格中,登录到 Azure。
az login --use-device-code查看选择的 Azure 订阅。
az account show -o table如果选择了错误的订阅,请使用 az account set 命令选择正确的订阅。
添加 Application Insights 的扩展。
az extension add -n application-insights创建 Application Insights 资源。
az monitor app-insights component create --app eShopLiteInsights --location eastus --kind web -g eShopLite你应该会看到以下输出:
{
  "appId": "00001111-aaaa-2222-bbbb-3333cccc4444",
  "applicationId": "eShopLiteInsights",
  "applicationType": "web",
  "connectionString": "InstrumentationKey=00000000-0000-0000-0000-000000000000;IngestionEndpoint=https://eastus-2.in.applicationinsights.azure.com/;LiveEndpoint=https://eastus.livediagnostics.monitor.azure.com/",
  "creationDate": "2023-11-10T16:50:00.950726+00:00",
  "disableIpMasking": null,
  "etag": "\"3a02952a-0000-0100-0000-654e5f380000\"",
  "flowType": "Bluefield",
  "hockeyAppId": null,
  "hockeyAppToken": null,
  "id": "/subscriptions/aaaa0a0a-bb1b-cc2c-dd3d-eeeeee4e4e4e/resourceGroups/eShopLite/providers/microsoft.insights/components/eShopLiteInsights",
  "immediatePurgeDataOn30Days": null,
  "ingestionMode": "ApplicationInsights",
  "instrumentationKey": "00000000-0000-0000-0000-000000000000",
  "kind": "web",
  "location": "eastus",
  "name": "eShopLiteInsights",
  "privateLinkScopedResources": null,
  "provisioningState": "Succeeded",
  "publicNetworkAccessForIngestion": "Enabled",
  "publicNetworkAccessForQuery": "Enabled",
  "requestSource": "rest",
  "resourceGroup": "eShopLite",
  "retentionInDays": 90,
  "samplingPercentage": null,
  "tags": {},
  "tenantId": "aaaabbbb-0000-cccc-1111-dddd2222eeee",
  "type": "microsoft.insights/components"
}
在上述返回的 JSON 中,复制
connectionString,但不包括 “。 例如:InstrumentationKey=b851fa75-85a2-42f7-bb6f-413725d9d8ba;IngestionEndpoint=https://eastus-2.in.applicationinsights.azure.com/;LiveEndpoint=https://eastus.livediagnostics.monitor.azure.com/在 Visual Studio Code 的“资源管理器”窗格中,选择“docker-compose.yml”文件。
你将添加诊断项目用于连接到 Application Insights 的环境变量。 将此 YAML 添加到 Store 服务:
environment:
  - APPLICATIONINSIGHTS_CONNECTION_STRING=InstrumentationKey=b851fa75-85a2-42f7-bb6f-413725d9d8ba;IngestionEndpoint=https://eastus-2.in.applicationinsights.azure.com/;LiveEndpoint=https://eastus.livediagnostics.monitor.azure.com/
将上述连接字符串替换为从 Azure CLI 复制的内容。
对“产品”服务重复这些步骤。 最终的 YAML 应如下所示:
  frontend:
    image: storeimage
    build:
      context: .
      dockerfile: ./eShopLite/Store/Dockerfile
    environment:
      - ProductEndpoint=http://backend:8080
      - ZIPKIN_URL=http://zipkin:9411
      - APPLICATIONINSIGHTS_CONNECTION_STRING=InstrumentationKey=b851fa75-85a2-42f7-bb6f-413725d9d8ba;IngestionEndpoint=https://eastus-2.in.applicationinsights.azure.com/;LiveEndpoint=https://eastus.livediagnostics.monitor.azure.com/
    ports:
      - "32000:8080"
    depends_on:
      - backend
      - prometheus
      - zipkin

  backend:
    image: productservice
    build:
      context: .
      dockerfile: ./eShopLite/Products/Dockerfile
    environment:
      - ZIPKIN_URL=http://zipkin:9411
      - APPLICATIONINSIGHTS_CONNECTION_STRING=InstrumentationKey=b851fa75-85a2-42f7-bb6f-413725d9d8ba;IngestionEndpoint=https://eastus-2.in.applicationinsights.azure.com/;LiveEndpoint=https://eastus.livediagnostics.monitor.azure.com/
按 Ctrl+S 保存文件。
在“终端”窗格中,转到“诊断”文件夹。
cd .\eShopLite\Diagnostics\添加 Application Insights 导出程序包。
dotnet add package Azure.Monitor.OpenTelemetry.AspNetCore --prerelease在“资源管理器”窗格中,选择“诊断”文件夹,然后选择“DiagnosticServiceCollectionExtensions.cs”。
在文件的顶部,添加此
using语句:using Azure.Monitor.OpenTelemetry.AspNetCore;在
var otelBuilder = services.AddOpenTelemetry();下,添加此代码:if (!string.IsNullOrEmpty(configuration["APPLICATIONINSIGHTS_CONNECTION_STRING"])) { otelBuilder.UseAzureMonitor(); }按 Ctrl+S 保存文件。
在底部的“终端”窗格中,转到 dotnet-observability/eShopLite 文件夹。
cd ..更新应用容器。
dotnet publish /p:PublishProfile=DefaultContainer转到 dotnet-observability 文件夹,并使用 Docker 启动应用:
cd ..
docker compose up
使用登录 Azure CLI 时所用的相同凭据登录到 Azure 门户。
在 Azure 门户中,选择“资源组”。
选择“eShopLite”资源组。
选择“eShopLiteInsights”Application Insights 资源。
选择“应用程序仪表板”。
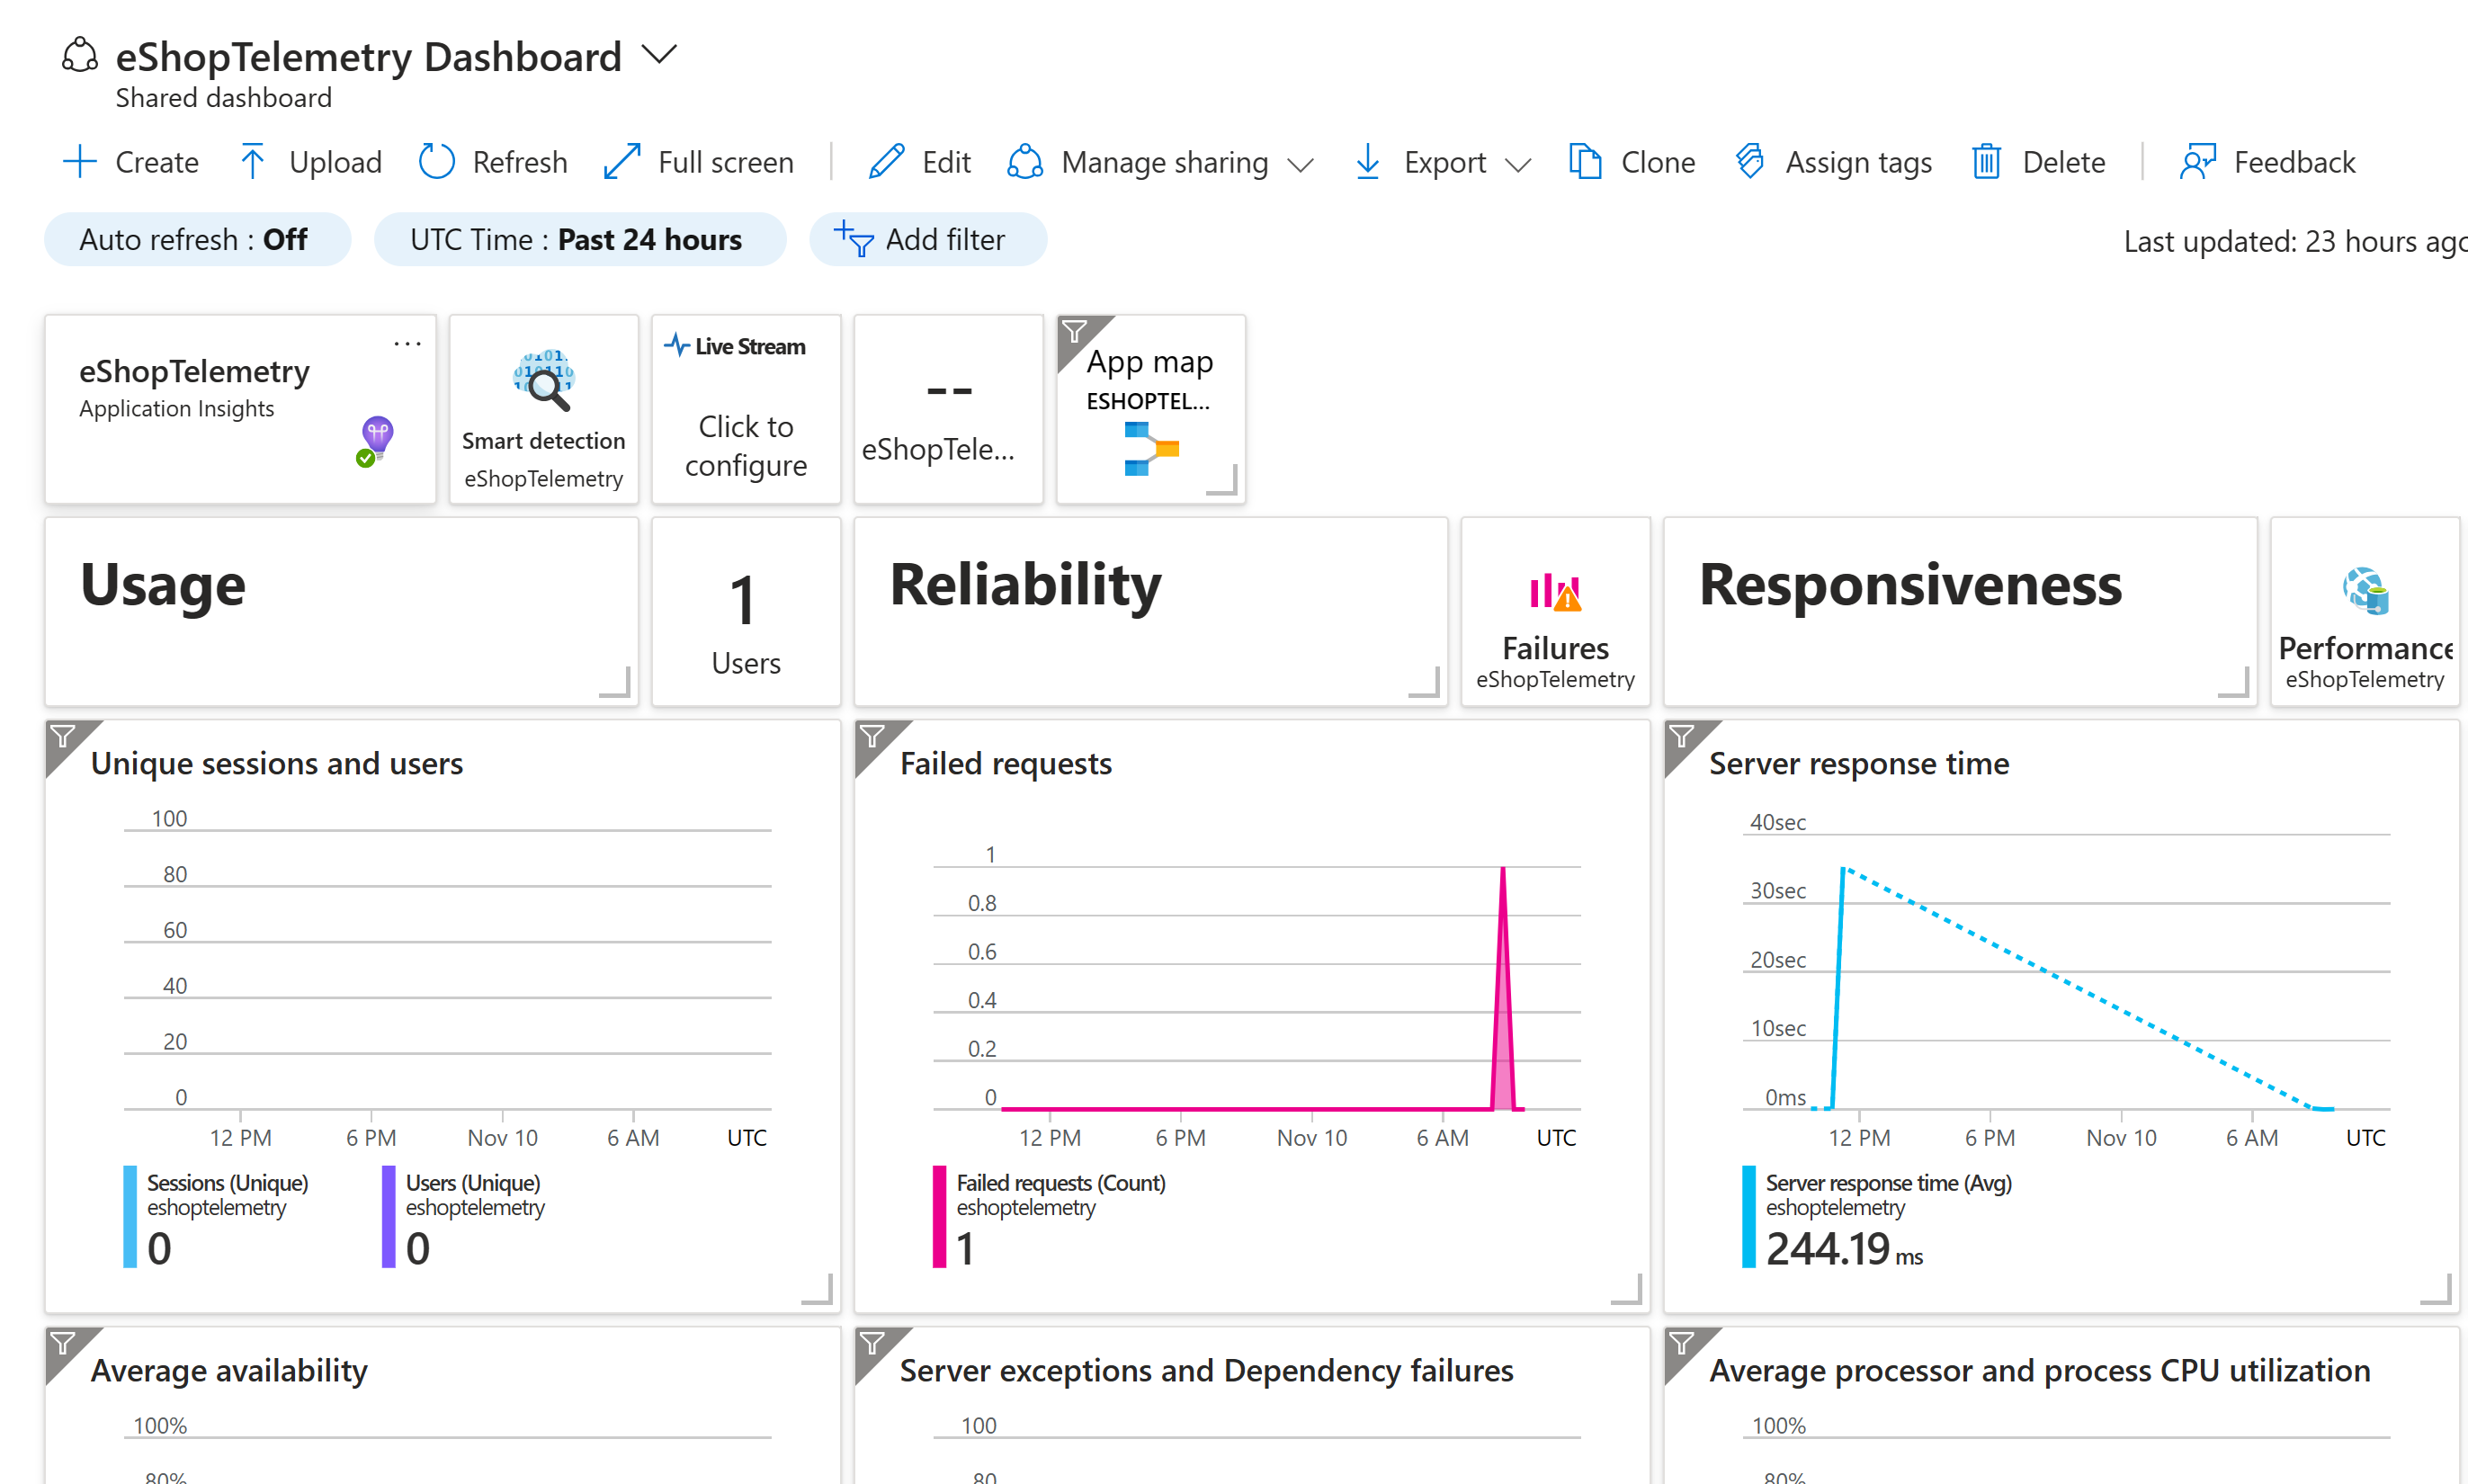
若要查看指标的更改,请转到 eShopLite 应用并更改库存。 然后刷新 Application Insights 仪表板。
在“终端”窗格中,按 CTRL+C 停止应用。
