收集、查询和直观呈现运行状况状态
若要准确表示运行状况模型,必须从系统中收集各种数据集。 数据集包括应用程序组件和基础 Azure 资源的日志和性能指标。 请务必关联数据集之间的数据,以便为系统生成运行状况的分层表示形式。
检测代码和基础结构
需要有统一的数据接收器,以确保所有操作数据都存储在收集所有遥测数据的单一位置并且可供使用。 例如,当员工在其 Web 浏览器中创建注释时,你可以跟踪此操作,并查看请求是否通过目录 API 发送到 Azure 事件中心。 在那里,后台处理器会拾取注释并将其存储在 Azure Cosmos DB 中。
Azure Monitor Log Analytics 用作核心 Azure 原生统一数据接收器,以便存储和分析操作数据:
Application Insights 是推荐的应用程序性能监视 (APM) 工具,可跨所有应用程序组件收集应用程序日志、指标和跟踪。 Application Insights 部署在每个区域基于工作区的配置中。
在示例应用程序中,Azure Functions 用于 Microsoft .NET 6 的后端服务,以便进行本机集成。 由于后端应用程序已存在,因此 Contoso Shoes 仅在 Azure 中创建新的 Application Insights 资源,并在这两个函数应用上配置
APPLICATIONINSIGHTS_CONNECTION_STRING设置。 Azure Functions 运行时会自动注册 Application Insights 日志记录提供程序,因此无需执行额外的操作即可在 Azure 中显示遥测。 要进一步自定义日志记录,可以使用ILogger接口。集中式数据集是任务关键型工作负载的一种反模式。 每个区域必须具有专用的 Log Analytics 工作区和 Application Insights 实例。 对于全局资源,建议使用单独的实例。 若要查看核心体系结构模式,请参阅 Azure 上任务关键型工作负载的体系结构模式。
每一层都应将数据发送到同一 Log Analytics 工作区,以便更轻松地进行分析和运行状况计算。

运行状况监视查询
Log Analytics、Application Insights 和 Azure 数据资源管理器都使用 Kusto 查询语言 (KQL) 进行查询。 可以使用 KQL 生成查询,并使用函数提取指标和计算运行状况分数。
有关计算运行状况的单个服务,请参阅以下示例查询。
目录 API
以下示例演示目录 API 查询:
let _maxAge = 2d; // Include data only from the last two days
let _timespanStart = ago(_maxAge); // Start time for the time span
let _timespanEnd = now(-2m); // Account for ingestion lag by stripping the last 2m
// For time frame, compare the averages to the following threshold values
let Thresholds=datatable(MetricName: string, YellowThreshold: double, RedThreshold: double) [
    "failureCount", 10, 50, // Failed requests, anything non-200, allow a few more than 0 for user-caused errors like 404s
    "avgProcessingTime", 150, 500 // Average duration of the request, in ms
    ];
// Calculate average processing time for each request
let avgProcessingTime = AppRequests
| where AppRoleName startswith "CatalogService"
| where OperationName != "GET /health/liveness" // Liveness requests don't do any processing, including them would skew the results
| make-series Value = avg(DurationMs) default=0 on TimeGenerated from _timespanStart to _timespanEnd step 1m
| mv-expand TimeGenerated, Value
| extend TimeGenerated = todatetime(TimeGenerated), Value=toreal(Value), MetricName= 'avgProcessingTime';
// Calculate failed requests
let failureCount = AppRequests
| where AppRoleName startswith "CatalogService" // Liveness requests don't do any processing, including them would skew the results
| where OperationName != "GET /health/liveness"
| make-series Value=countif(Success != true) default=0 on TimeGenerated from _timespanStart to _timespanEnd step 1m
| mv-expand TimeGenerated, Value
| extend TimeGenerated = todatetime(TimeGenerated), Value=toreal(Value), MetricName= 'failureCount';
// Union all together and join with the thresholds
avgProcessingTime
| union failureCount
| lookup kind = inner Thresholds on MetricName
| extend IsYellow = iff(todouble(Value) > YellowThreshold and todouble(Value) < RedThreshold, 1, 0)
| extend IsRed = iff(todouble(Value) > RedThreshold, 1, 0)
| project-reorder TimeGenerated, MetricName, Value, IsYellow, IsRed, YellowThreshold, RedThreshold
| extend ComponentName="CatalogService"
Azure Key Vault
以下示例演示 Azure Key Vault 查询:
let _maxAge = 2d; // Include data only from the last two days
let _timespanStart = ago(_maxAge); // Start time for the time span
let _timespanEnd = now(-2m); // Account for ingestion lag by stripping the last 2m
// For time frame, compare the averages to the following threshold values
let Thresholds = datatable(MetricName: string, YellowThreshold: double, RedThreshold: double) [
    "failureCount", 3, 10 // Failure count on key vault requests
    ];
let failureStats = AzureDiagnostics
| where TimeGenerated > _timespanStart
| where ResourceProvider == "MICROSOFT.KEYVAULT"
// Ignore authentication operations that have a 401. This is normal when using Key Vault SDK. First an unauthenticated request is made, then the response is used for authentication
| where Category=="AuditEvent" and not (OperationName == "Authentication" and httpStatusCode_d == 401)
| where OperationName in ('SecretGet','SecretList','VaultGet') or '*' in ('SecretGet','SecretList','VaultGet')
// Exclude Not Found responses because these happen regularly during 'Terraform plan' operations, when Terraform checks for the existence of secrets
| where ResultSignature != "Not Found"
// Create ResultStatus with all the 'success' results bucketed as 'Success'
// Certain operations like StorageAccountAutoSyncKey have no ResultSignature; for now, also set to 'Success'
| extend ResultStatus = case ( ResultSignature == "", "Success",
                               ResultSignature == "OK", "Success",
                               ResultSignature == "Accepted", "Success",
                               ResultSignature);
failureStats
| make-series Value=countif(ResultStatus != "Success") default=0 on TimeGenerated from _timespanStart to _timespanEnd step 1m
| mv-expand TimeGenerated, Value
| extend TimeGenerated = todatetime(TimeGenerated), Value=toreal(Value), MetricName="failureCount", ComponentName="Keyvault"
| lookup kind = inner Thresholds on MetricName
| extend IsYellow = iff(todouble(Value) > YellowThreshold and todouble(Value) < RedThreshold, 1, 0)
| extend IsRed = iff(todouble(Value) > RedThreshold, 1, 0)
目录服务运行状况分数
最后,可以将各种运行状况查询捆绑在一起,以计算组件的运行状况分数。 以下示例查询演示如何计算目录服务运行状况分数:
CatalogServiceHealthStatus()
| union AksClusterHealthStatus()
| union KeyvaultHealthStatus()
| union EventHubHealthStatus()
| where TimeGenerated < ago(2m)
| summarize YellowScore = max(IsYellow), RedScore = max(IsRed) by bin(TimeGenerated, 2m)
| extend HealthScore = 1 - (YellowScore * 0.25) - (RedScore * 0.5)
| extend ComponentName = "CatalogService", Dependencies="AKSCluster,Keyvault,EventHub" // These values are added to build the dependency visualization
| order by TimeGenerated desc
提示
在 Azure Mission-Critical Online GitHub 存储库中查看更多查询示例。
设置基于查询的警报
警报会立即引起对反映或影响运行状况状态的问题的关注。 每当运行状况状态发生变化时,无论是降级(黄色)状态还是运行不正常(红色)状态,都应向负责团队发送通知。 在运行状况模型的根节点上设置警报,以立即了解解决方案运行状况中的任何业务级更改。 然后,可以查看运行状况模型可视化效果以获取详细信息并进行故障排除。
该示例使用 Azure Monitor 警报来推动执行自动化操作,以响应应用程序运行状况状态的更改。
使用仪表板进行可视化
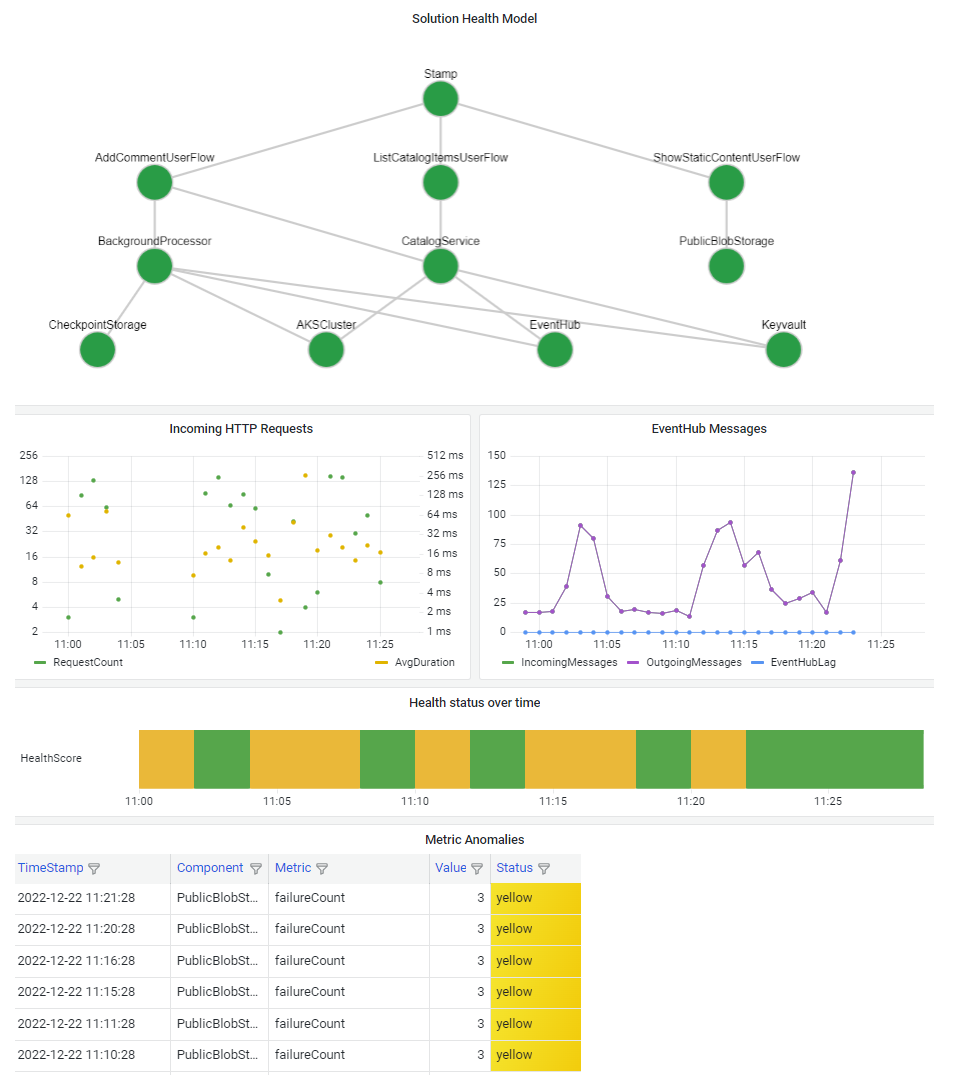
请务必直观呈现运行状况模型,以便快速了解组件中断对整个系统的影响。 运行状况模型的最终目标是针对偏离稳定状态的情况提供可靠的视图,促进快速诊断。
直观呈现系统运行状况信息的常见方法是将分层运行状况模型视图与仪表板中的遥测向下钻取功能相结合。

仪表板技术应该能够表示运行状况模型。 常用选项包括 Azure 仪表板、Power BI 和 Azure 托管 Grafana。