练习 - 使用 Scikit Learn 执行线性回归
另一个在研究社区中广泛使用的常用 Python 库是 scikit-learn,它擅长构建机器学习模型,以帮助从数据中提取信息。 在本练习中,你将使用 scikit-learn(已于第 2 单元中导入)计算 NASA 气候数据的趋势线。
将光标放在笔记本底部的空白单元格中。 将单元格类型更改为 Markdown 并输入文本“使用 scikit-learn 执行线性回归”。
添加 Code 单元格并将以下代码粘贴到其中。
# Pick the Linear Regression model and instantiate it
model = LinearRegression(fit_intercept=True)

# Fit/build the model
model.fit(yearsBase[:, np.newaxis], meanBase)
mean_predicted = model.predict(yearsBase[:, np.newaxis])

# Generate a plot like the one in the previous exercise
plt.scatter(yearsBase, meanBase)
plt.plot(yearsBase, mean_predicted)
plt.title('scatter plot of mean temp difference vs year')
plt.xlabel('years', fontsize=12)
plt.ylabel('mean temp difference', fontsize=12)
plt.show()

print(' y = {0} * x + {1}'.format(model.coef_[0], model.intercept_))
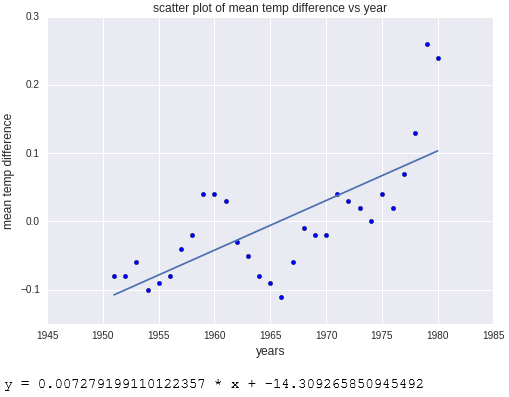
现在运行单元格以显示带回归线的散点图。

sckikit-learn 计算出的带回归线的散点图
输出与上一个练习的输出几乎一样。 不同之处是 scikit-learn 完成了更多工作。 具体而言,你不用再像使用 NumPy 时那样编写一个线函数;scikit-learn 的 LinearRegression 函数已为你完成此工作。 scikit-learn 支持许多不同类型的回归,在构建复杂的机器学习模型时非常好用。