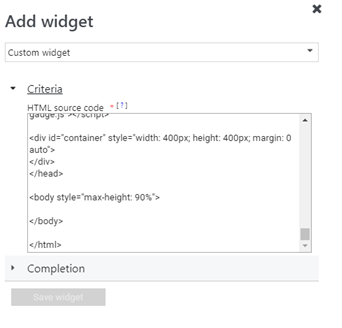
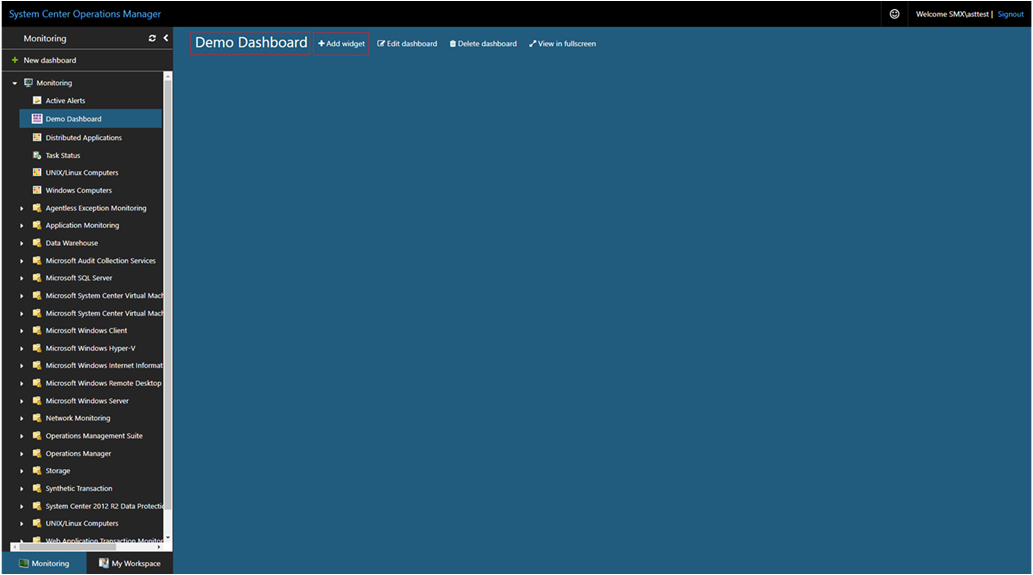
在 System Center Operations Manager 中,Web 控制台为管理组提供一个监视界面,该接口可在任何计算机上使用连接到 Web 控制台服务器的任何浏览器打开。 以下步骤介绍如何将自定义小组件添加到新的 HTML5 Web 控制台中的仪表板,该控制台使用基于 REST 的新 API。 它执行指定的 HTML 代码,并在各种可视化效果中可视化所需的输出。
若要确定每个数据类型的监视数据的范围,可以选择一个类来查看该类的所有实例,或者仅查看所选类的一部分对象,还可以包括一个组。 例如,若要指定 Windows Server DC 计算机类的所有对象,可以修改 classId 的属性值。
以下 HTML 代码演示如何呈现包含状态数据的条形图:
<!DOCTYPE HTML>
<html>
<head>
<script src="https://ajax.googleapis.com/ajax/libs/jquery/3.2.1/jquery.min.js"></script>
<script type="text/javascript">
var criticalCounter = 0;
var healthyCounter = 0;
var warningCounter = 0;
var unmonitoredCounter = 0;
window.onload = function () {
$.ajax({
url: "/OperationsManager/data/state",
type: "POST",
data: JSON.stringify({
"classId": "System.Library!System.Computer",
"objectIds": {
// Key value pairs => id: 0 (For objects)/-1 (For groups)
"1d62280e-f437-1369-316b-1e8659500e9a": -1
},
"criteria": "((HealthState = '0') OR (HealthState = '1') OR (HealthState = '2') OR (HealthState = '3') OR HealthState is null)",
"displayColumns": [
"healthstate",
"displayname",
"path",
"maintenancemode"
]
}),
success: function (result) {
for (var i = 0; i < result.rows.length; i++) {
switch (result.rows[i].healthstate) {
case "critical":
criticalCounter++;
break;
case "healthy":
healthyCounter++;
break;
case "warning":
warningCounter++;
break;
case "unmonitored":
unmonitoredCounter++;
break;
}
}
renderChart();
}
});
}
function renderChart() {
var chart = new CanvasJS.Chart("chartContainer", {
title: {
text: "Health State of Windows Computers"
},
data: [{
type: "column",
dataPoints: [
{ y: criticalCounter, label: "Critical", color: "Red" },
{ y: healthyCounter, label: "Healthy", color: "Green" },
{ y: warningCounter, label: "Warning", color: "Yellow" },
{ y: unmonitoredCounter, label: "Unmonitored", color: "Gray" }
]
}]
});
chart.render();
}
</script>
<script src="https://cdnjs.cloudflare.com/ajax/libs/canvasjs/1.7.0/canvasjs.min.js"></script>
<title>CanvasJS Example</title>
</head>
<body>
<div id="chartContainer" style="height: 400px; width: 100%;"></div>
</body>
</html>
以下 HTML 代码演示如何使用性能数据呈现样条图表:
<!DOCTYPE HTML>
<html>
<head>
<script src="https://ajax.googleapis.com/ajax/libs/jquery/3.2.1/jquery.min.js"></script>
<script type="text/javascript">
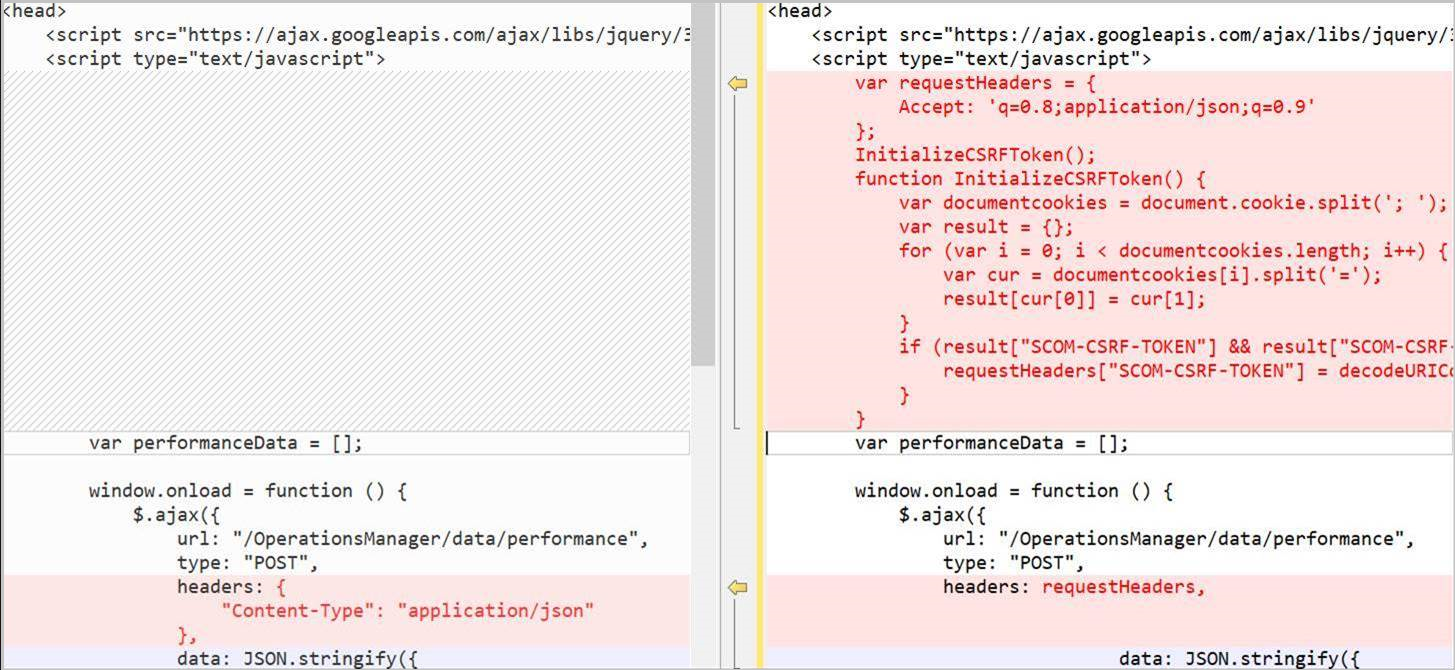
var performanceData = [];
window.onload = function () {
$.ajax({
url: "/OperationsManager/data/performance",
type: "POST",
headers: {
"Content-Type": "application/json"
},
data: JSON.stringify({
"id":"6f7e3306-beeb-2996-3795-7c1eafb925b8",
"performanceCounters":[
{
"objectname":"Health Service",
"countername":"agent processor utilization",
"instancename":""
}
],
"legends":[
"target",
"path",
"lastvalue"
],
"duration":4320
}),
success: function (result) {
let dataDictionary = result.datasets[0].data;
let sum = new Array(24).fill(0.0);
let count = new Array(24).fill(0.0);
for (var key in dataDictionary) {
if(dataDictionary.hasOwnProperty(key)) {
var datetime = new Date(key);
datetime = convertUTCDateToLocalDate(datetime);
sum[datetime.getHours()] += dataDictionary[key];
count[datetime.getHours()]++;
}
}
let tDate = new Date();
tDate.setHours(0,0,0,0);
for(var i=0; i<24; i++) {
performanceData.push({
y: sum[i] / count[i],
x: new Date(tDate.getTime())
});
tDate.setHours(tDate.getHours()+1);
}
renderChart();
}
});
}
function convertUTCDateToLocalDate(date) {
var newDate = new Date(date.getTime()+date.getTimezoneOffset()*60*1000);
var offset = date.getTimezoneOffset() / 60;
newDate.setMinutes(date.getMinutes() - date.getTimezoneOffset())
return newDate;
}
function renderChart() {
var chart = new CanvasJS.Chart("chartContainer", {
title: {
text: "Average Processor Utilization for Last 3 Days"
},
axisX: {
labelFormatter: function(e) {
return CanvasJS.formatDate(e.value, "hh:mm tt");
}
},
data: [{
type: "spline",
dataPoints: performanceData
}]
});
chart.render();
}
</script>
<script src="https://cdnjs.cloudflare.com/ajax/libs/canvasjs/1.7.0/canvasjs.min.js"></script>
<title>CanvasJS Example</title>
</head>
<body>
<div id="chartContainer" style="height: 100%; width: 100%;"></div>
</body>
</html>
以下 HTML 代码演示如何呈现包含警报数据的条形图:
<!DOCTYPE HTML>
<html>

<head>
    <script src="https://ajax.googleapis.com/ajax/libs/jquery/3.2.1/jquery.min.js"></script>
    <script type="text/javascript">
        var criticalCounter = 0;
        var informationCounter = 0;
        var warningCounter = 0;

        window.onload = function () {
            $.ajax({
                url: "/OperationsManager/data/alert",
                type: "POST",
data: JSON.stringify({
"classId": null,
"objectIds": { "3c8ac4f3-475e-44dd-4163-8a97af363705": -1 },
"criteria": "((Severity = '0') OR (Severity = '1') OR (Severity = '2') OR (Severity = '3')) AND ((Priority = '2') OR (Priority = '1') OR (Priority = '0')) AND ((ResolutionState = '0') OR (ResolutionState = '247') OR (ResolutionState = '248') OR (ResolutionState = '249') OR (ResolutionState = '250') OR (ResolutionState = '254') OR (ResolutionState = '255'))",
"displayColumns":
[
"severity","monitoringobjectdisplayname","name","age","repeatcount","lastModified"
]
}),
success: function (result) {
for (var i = 0; i < result.rows.length; i++) {
switch(result.rows[i].severity)
{
case "Error":
criticalCounter++;
break;
case "Information":
informationCounter++;
break;
case "Warning":
warningCounter++
break;
}
}
renderChart();
}
});
}
function renderChart() {
var chart = new CanvasJS.Chart("chartContainer", {
title: {
text: "Alerts representation in bar chart"
},
data: [{
type: "column",
dataPoints: [
{ y: criticalCounter, label: "Critical" },
{ y: warningCounter, label: "Warning" },
{ y: informationCounter, label: "Information" }
]
}]
});
chart.render();
}
</script>
<script src="https://cdnjs.cloudflare.com/ajax/libs/canvasjs/1.7.0/canvasjs.min.js"></script>
<title>CanvasJS Example</title>
</head>
<body>
<div id="chartContainer" style="height: 400px; width: 100%;"></div>
</body>
</html>
以下 HTML 代码演示如何呈现包含警报数据的饼图:
<!DOCTYPE HTML>
<html>

<head>
    <script src="https://ajax.googleapis.com/ajax/libs/jquery/3.2.1/jquery.min.js"></script>
    <script type="text/javascript">
        var criticalCounter = 0;
        var informationCounter = 0;
        var warningCounter = 0;

        window.onload = function () {
            $.ajax({
                url: "/OperationsManager/data/alert",
                type: "POST",
                data: JSON.stringify({
                    "classId": null,
                    "objectIds": { "3c8ac4f3-475e-44dd-4163-8a97af363705": -1 },
                    "criteria": "((Severity = '0') OR (Severity = '1') OR (Severity = '2') OR (Severity = '3')) AND ((Priority = '2') OR (Priority = '1') OR (Priority = '0')) AND ((ResolutionState = '0') OR (ResolutionState = '247') OR (ResolutionState = '248') OR (ResolutionState = '249') OR (ResolutionState = '250') OR (ResolutionState = '254') OR (ResolutionState = '255'))",
                    "displayColumns":
                    [
                        "severity","monitoringobjectdisplayname","name","age","repeatcount","lastModified"
                    ]
                }),
                success: function (result) {
                    for (var i = 0; i < result.rows.length; i++) {
            switch(result.rows[i].severity)
            {
                case "Error":
                    criticalCounter++;
                    break;
                case "Information":
                    informationCounter++;
                    break;
                case "Warning":
                                    warningCounter++
                    break;
            }
                    }
                    renderChart();
                }
            });
        }

        function renderChart() {
            var chart = new CanvasJS.Chart("chartContainer",
                {
                    theme: "theme2",
                    title: {
                        text: "Alerts representation in Pie chart"
                    },
                    data: [
                        {
                            type: "pie",
                            showInLegend: true,
                            toolTipContent: "{y} - #percent %",
                            legendText: "{indexLabel}",
                            dataPoints: [
                                { y: criticalCounter, indexLabel: "Critical" },
                                { y: warningCounter, indexLabel: "Warning" },
                                { y: informationCounter, indexLabel: "Information" }
                            ]
                        }
                    ]
                });
            chart.render();
        }
    </script>
    <script src="https://cdnjs.cloudflare.com/ajax/libs/canvasjs/1.7.0/canvasjs.min.js"></script>
    <title>CanvasJS Example</title>
</head>

<body>
    <div id="chartContainer" style="height: 400px; width: 100%;"></div>
</body>

</html>
以下 HTML 代码演示如何呈现包含警报数据的 3D 饼图:
<!DOCTYPE HTML>
<html>

<head>
    <script src="https://ajax.googleapis.com/ajax/libs/jquery/3.2.1/jquery.min.js"></script>
    <script type="text/javascript">
        var criticalCounter = 0;
        var informationCounter = 0;
        var warningCounter = 0;

        window.onload = function () {
            $.ajax({
                url: "/OperationsManager/data/alert",
                type: "POST",
                data: JSON.stringify({
                    "classId": null,
                    "objectIds": { "3c8ac4f3-475e-44dd-4163-8a97af363705": -1 },
                    "criteria": "((Severity = '0') OR (Severity = '1') OR (Severity = '2') OR (Severity = '3')) AND ((Priority = '2') OR (Priority = '1') OR (Priority = '0')) AND ((ResolutionState = '0') OR (ResolutionState = '247') OR (ResolutionState = '248') OR (ResolutionState = '249') OR (ResolutionState = '250') OR (ResolutionState = '254') OR (ResolutionState = '255'))",
                    "displayColumns":
                    [
                        "severity","monitoringobjectdisplayname","name","age","repeatcount","lastModified"
                    ]
                }),
                success: function (result) {
                    for (var i = 0; i < result.rows.length; i++) {
            switch(result.rows[i].severity)
            {
                case "Error":
                    criticalCounter++;
                    break;
                case "Information":
                    informationCounter++;
                    break;
                case "Warning":
                                    warningCounter++
                    break;
            }
                    }
                    renderChart();
                }
            });
        }

        function renderChart() {
            var chart = new Highcharts.chart('container', {
    chart: {
        type: 'pie',
        options3d: {
            enabled: true,
            alpha: 45,
            beta: 0
        }
    },
    title: {
        text: 'Alerts share per severity'
    },
    tooltip: {
        pointFormat: '{series.name}: <b>{point.percentage:.1f}%</b>'
    },
    plotOptions: {
        pie: {
            allowPointSelect: true,
            cursor: 'pointer',
            depth: 35,
            dataLabels: {
                enabled: true,
                format: '{point.name}'
            }
        }
    },
    series: [{
        type: 'pie',
        name: 'Alerts share',
        data: [
            {
                name: 'Critical',
                y: 48,
                sliced: true,
                selected: true
            },
            ['Warning', 39],
            ['Information', 13],
        ]
    }]
});

            chart.render();
        }
    </script>
   <script src="https://code.highcharts.com/highcharts.js"></script>
<script src="https://code.highcharts.com/highcharts-3d.js"></script>
<script src="https://code.highcharts.com/modules/exporting.js"></script>

<div id="container" style="height: 400px"></div>
</head>

<body>
    <div id="chartContainer" style="height: 400px; width: 100%;"></div>
</body>

</html>
以下 HTML 代码演示如何呈现包含警报数据的圆环图:
<!DOCTYPE HTML>
<html>

<head>
    <script src="https://ajax.googleapis.com/ajax/libs/jquery/3.2.1/jquery.min.js"></script>
    <script type="text/javascript">
        var criticalCounter = 0;
        var informationCounter = 0;
        var warningCounter = 0;

        window.onload = function () {
            $.ajax({
                url: "/OperationsManager/data/alert",
                type: "POST",
                data: JSON.stringify({
                    "classId": null,
                    "objectIds": { "3c8ac4f3-475e-44dd-4163-8a97af363705": -1 },
                    "criteria": "((Severity = '0') OR (Severity = '1') OR (Severity = '2') OR (Severity = '3')) AND ((Priority = '2') OR (Priority = '1') OR (Priority = '0')) AND ((ResolutionState = '0') OR (ResolutionState = '247') OR (ResolutionState = '248') OR (ResolutionState = '249') OR (ResolutionState = '250') OR (ResolutionState = '254') OR (ResolutionState = '255'))",
                    "displayColumns":
                    [
                        "severity","monitoringobjectdisplayname","name","age","repeatcount","lastModified"
                    ]
                }),
                success: function (result) {
                    for (var i = 0; i < result.rows.length; i++) {
            switch(result.rows[i].severity)
            {
                case "Error":
                    criticalCounter++;
                    break;
                case "Information":
                    informationCounter++;
                    break;
                case "Warning":
                                    warningCounter++
                    break;
            }
                    }
                    renderChart();
                }
            });
        }

        function renderChart() {
            var chart = new CanvasJS.Chart("chartContainer",
                {
                    theme: "theme2",
animationEnabled: true,
                    title: {
                        text: "Alerts representation in doughnut"
                    },
                    data: [
                        {
                            type: "doughnut",
                indexLabelFontFamily: "Garamond",
                indexLabelFontSize: 20,
                startAngle:0,
                indexLabelFontColor: "dimgrey",
                indexLabelLineColor: "darkgrey",
                toolTipContent: "{y} %",
                            dataPoints: [
                                { y: criticalCounter, indexLabel: "Critical" },
                                { y: warningCounter, indexLabel: "Warning" },
                                { y: informationCounter, indexLabel: "Information" }
                            ]
                        }
                    ]
                });
            chart.render();
        }
    </script>
    <script src="https://cdnjs.cloudflare.com/ajax/libs/canvasjs/1.7.0/canvasjs.min.js"></script>
    <title>CanvasJS Example</title>
</head>

<body>
    <div id="chartContainer" style="height: 400px; width: 100%;"></div>
</body>

</html>
以下 HTML 代码演示如何呈现包含警报数据的 3D 圆环图:
<!DOCTYPE HTML>
<html>

<head>
    <script src="https://ajax.googleapis.com/ajax/libs/jquery/3.2.1/jquery.min.js"></script>
    <script type="text/javascript">
        var criticalCounter = 0;
        var informationCounter = 0;
        var warningCounter = 0;

        window.onload = function () {
            $.ajax({
                url: "/OperationsManager/data/alert",
                type: "POST",
                data: JSON.stringify({
                    "classId": null,
                    "objectIds": { "3c8ac4f3-475e-44dd-4163-8a97af363705": -1 },
                    "criteria": "((Severity = '0') OR (Severity = '1') OR (Severity = '2') OR (Severity = '3')) AND ((Priority = '2') OR (Priority = '1') OR (Priority = '0')) AND ((ResolutionState = '0') OR (ResolutionState = '247') OR (ResolutionState = '248') OR (ResolutionState = '249') OR (ResolutionState = '250') OR (ResolutionState = '254') OR (ResolutionState = '255'))",
                    "displayColumns":
                    [
                        "severity","monitoringobjectdisplayname","name","age","repeatcount","lastModified"
                    ]
                }),
                success: function (result) {
                    for (var i = 0; i < result.rows.length; i++) {
            switch(result.rows[i].severity)
            {
                case "Error":
                    criticalCounter++;
                    break;
                case "Information":
                    informationCounter++;
                    break;
                case "Warning":
                                    warningCounter++
                    break;
            }
                    }
                    renderChart();
                }
            });
        }

        function renderChart() {
            var chart = Highcharts.chart('container', {
    chart: {
        type: 'pie',
        options3d: {
            enabled: true,
            alpha: 45
        }
    },
    title: {
        text: 'Alerts representation in 3D donut'
    },
    subtitle: {
        text: ''
    },
    plotOptions: {
        pie: {
            innerSize: 100,
            depth: 45
        }
    },
    series: [{
        name: 'Number of alerts',
        data: [
        ['Critical', criticalCounter],
                                ['Warning', warningCounter ],
                                ['Information',  informationCounter]

        ]
    }]
});
            chart.render();
        }
    </script>
    <script src="https://code.highcharts.com/highcharts.js"></script>
<script src="https://code.highcharts.com/highcharts-3d.js"></script>
<script src="https://code.highcharts.com/modules/exporting.js"></script>

<div id="container" style="height: 400px">
</div>
</head>

<body>
    <div id="chartContainer" style="height: 400px; width: 100%;"></div>
</body>

</html>
以下 HTML 代码演示如何创建组合图表以在饼图和样条图中显示警报:
<!DOCTYPE HTML>
<html>

<head>
    <script src="https://ajax.googleapis.com/ajax/libs/jquery/3.2.1/jquery.min.js"></script>
    <script type="text/javascript">
        var criticalCounter = 0;
        var informationCounter = 0;
        var warningCounter = 0;
var totalCounter =0;

        window.onload = function () {
            $.ajax({
                url: "/OperationsManager/data/alert",
                type: "POST",
                data: JSON.stringify({
                    "classId": null,
                    "objectIds": { "3c8ac4f3-475e-44dd-4163-8a97af363705": -1 },
                    "criteria": "((Severity = '0') OR (Severity = '1') OR (Severity = '2') OR (Severity = '3')) AND ((Priority = '2') OR (Priority = '1') OR (Priority = '0')) AND ((ResolutionState = '0') OR (ResolutionState = '247') OR (ResolutionState = '248') OR (ResolutionState = '249') OR (ResolutionState = '250') OR (ResolutionState = '254') OR (ResolutionState = '255'))",
                    "displayColumns":
                    [
                        "severity","monitoringobjectdisplayname","name","age","repeatcount","lastModified"
                    ]
                }),
                success: function (result) {
                    for (var i = 0; i < result.rows.length; i++) {
            switch(result.rows[i].severity)
            {
                case "Error":
                    criticalCounter++;
                    break;
                case "Information":
                    informationCounter++;
                    break;
                case "Warning":
                                    warningCounter++
                    break;
            }
                    }
                    renderChart();
                }
            });
        }

        function renderChart() {
            var chart = new Highcharts.chart('container', {
    title: {
        text: 'Alerts representation in combination chart'
    },
    xAxis: {
        categories: ['Critical', 'Warning', 'Information']
    },
    labels: {
        items: [{
            html: 'Total alerts generated',
            style: {
                left: '50px',
                top: '0px',
                color: (Highcharts.theme && Highcharts.theme.textColor) || 'black'
            }
        }]
    },
    series: [{
        type: 'column',
        name: 'Critical',
        data: [criticalCounter, 0, 0]
    }, {
        type: 'column',
        name: 'Warning',
        data: [0, warningCounter, 0]
    }, {
        type: 'column',
        name: 'Information',
        data: [0, 0, informationCounter]
    }, {
        type: 'spline',
        name: 'Spline chart',
        data: [criticalCounter, warningCounter, informationCounter],
        marker: {
            lineWidth: 2,
            lineColor: Highcharts.getOptions().colors[3],
            fillColor: 'white'
        }
    }, {
        type: 'pie',
        name: 'Total consumption',
        data: [{
            name: 'Critical',
            y: criticalCounter,
            color: Highcharts.getOptions().colors[0] // Jane's color
        }, {
            name: 'Warning',
            y: warningCounter,
            color: Highcharts.getOptions().colors[1] // John's color
        }, {
            name: 'Information',
            y: informationCounter,
            color: Highcharts.getOptions().colors[2] // Joe's color
        }],
        center: [150, 100],
        size: 100,
        showInLegend: false,
        dataLabels: {
            enabled: false
        }
    }]
});


            chart.render();
        }
    </script>
    <script src="https://code.highcharts.com/highcharts.js"></script>
<script src="https://code.highcharts.com/modules/exporting.js"></script>

<div id="container" style="min-width: 310px; height: 400px; margin: 0 auto"></div>

</head>

<body>
    <div id="chartContainer" style="height: 400px; width: 100%;"></div>
</body>

</html>


