在 Jupyter 笔记本中快速创建报表
如果使用的是 Jupyter 笔记本,则只需几个步骤即可生成 Power BI 快速报表,而无需离开笔记本。 借助快速报表,可以使用笔记本体验中的 Power BI 可视化功能来轻松讲述数据的故事。
快速报表临时报表,不会自动保存。 每次运行代码时,都会创建一个新报表并移除旧报表。 可以手动保存报表,以便以后在笔记本或 Power BI 中使用。
先决条件
导入模块
在笔记本中使用 DataFrame 需要以下模块:
- 来自
powerbiclient的QuickVisualize和get_dataset_config pandas
from powerbiclient import QuickVisualize, get_dataset_config
import pandas as pd
创建 pandas DataFrame
创建 pandas DataFrame 并对其进行更新。 以下示例演示了根据示例 CSV 文件创建 DataFrame 的示例,但你可以根据需要以任何方式创建自己的 DataFrame。
# Import your own CSV as a pandas data frame
df = pd.read_csv('Financial Sample.csv')

# Perform preprocessing
df = df.drop(['Month Number', 'Month Name', 'Year'], axis=1)
df = df.loc[df['Units Sold'] > 1000]
df['Discounted'] = df['Discount Band'] != 'None'
进行 Power BI 身份验证
# Import the DeviceCodeLoginAuthentication class to authenticate against Power BI
from powerbiclient.authentication import DeviceCodeLoginAuthentication

# Initiate device authentication
device_auth = DeviceCodeLoginAuthentication()
有关身份验证的详细信息,请查看 github wiki 页面。
创建和呈现快速可视化实例
根据创建的 DataFrame 创建 QuickVisualize 实例。 如果使用的是 pandas DataFrame,则可以使用我们的实用工具函数(如以下代码片段所示)创建报表。 如果使用的是 pandas 以外的 DataFrame,请自行分析数据。
# Create a Power BI report from your data
PBI_visualize = QuickVisualize(get_dataset_config(df), auth=device_auth)
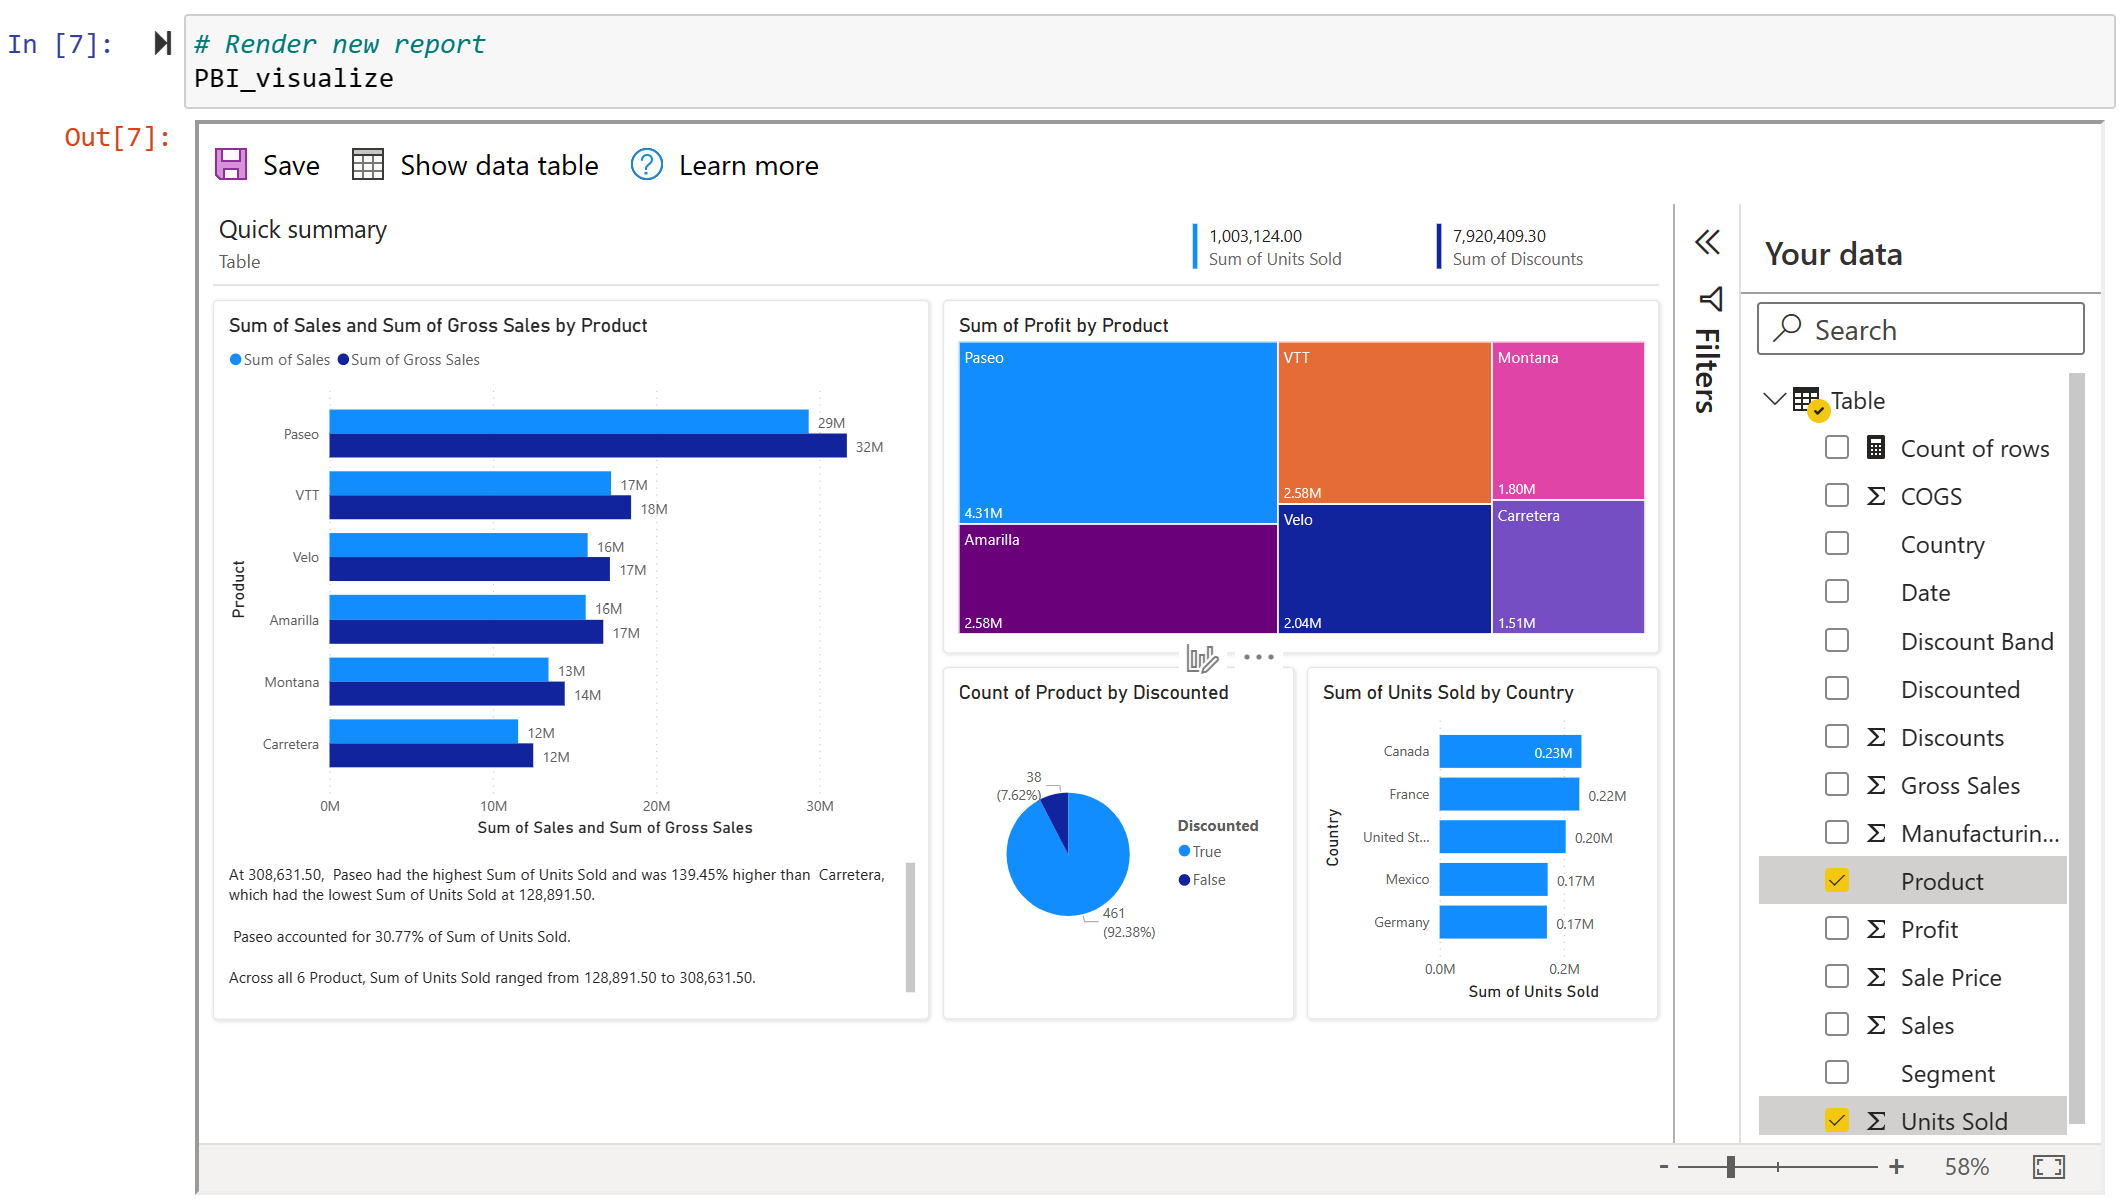
# Render new report
PBI_visualize
自定义报表(可选)
创建报表后,可以对其进行自定义,以从数据中获取最有价值的见解,并为笔记本中的报表创建完美的匹配项。
编辑视觉对象并进行保存。
有关详细信息,请参阅与 Power BI 服务中自动生成的“快速”报表交互。
定义容器的大小。
# Set new width and height for the container
PBI_visualize.set_size(400, 600)
如需获取演示 Jupyter 笔记本,请参阅 GitHub 存储库。
相关内容
更多问题? 尝试咨询 Power BI 社区