Office 脚本示例方案:从 NOAA 提取和绘制水位数据
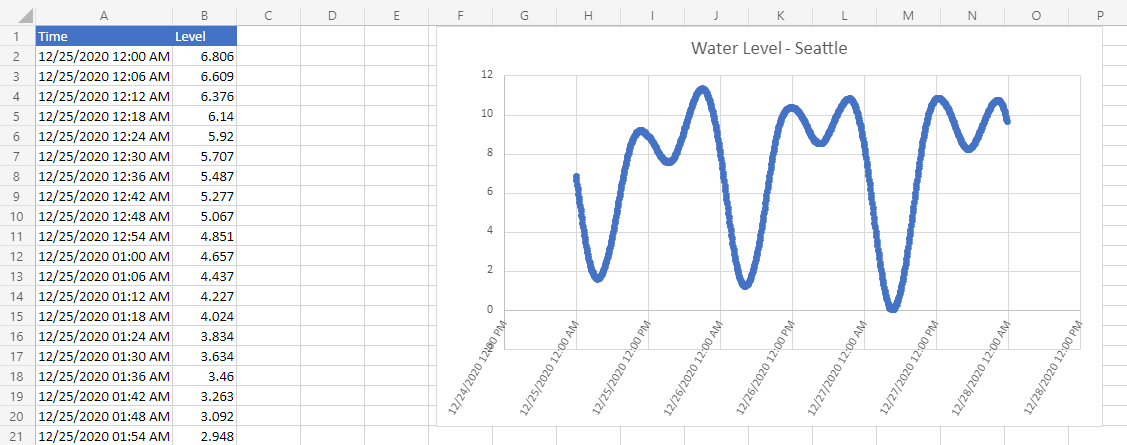
在此方案中,你需要绘制 国家海洋和大气管理局西雅图站的水位。 你将使用外部数据填充电子表格并创建图表。
你将开发一个脚本, fetch 该脚本使用 命令查询 NOAA Tides 和 Currents 数据库。 这将获取给定时间跨度记录的水位。 信息将作为 JSON 返回,因此部分脚本会将该信息转换为范围值。 数据进入电子表格后,将用于创建图表。
有关使用 JSON 的详细信息,请阅读 使用 JSON 将数据传入 Office 脚本和从 Office 脚本传递数据。
涵盖的脚本技能
- 外部 API 调用 (
fetch) - JSON 分析
- 图表
设置说明
在 Excel 中打开工作簿。
在“ 自动 ”选项卡下,选择“ 新建脚本 ”,并将以下脚本粘贴到编辑器中。
/**
 * Gets data from the National Oceanic and Atmospheric Administration's Tides and Currents database.
 * That data is used to make a chart.
 */
async function main(workbook: ExcelScript.Workbook) {
  // Get the current sheet.
  let currentSheet = workbook.getActiveWorksheet();

  // Create selection of parameters for the fetch URL.
  // More information on the NOAA APIs is found here:
  // https://api.tidesandcurrents.noaa.gov/api/prod/
  const option = "water_level";
  const startDate = "20201225"; /* yyyymmdd date format */
  const endDate = "20201227";
  const station = "9447130"; /* Seattle */

  // Construct the URL for the fetch call.
  const strQuery = `https://api.tidesandcurrents.noaa.gov/api/prod/datagetter?product=${option}&begin_date=${startDate}&end_date=${endDate}&datum=MLLW&station=${station}&units=english&time_zone=gmt&application=NOS.COOPS.TAC.WL&format=json`;

  console.log(strQuery);

  // Resolve the Promises returned by the fetch operation.
  const response = await fetch(strQuery);
  const rawJson: string = await response.json();

  // Translate the raw JSON into a usable state.
  const stringifiedJson = JSON.stringify(rawJson);

  // Note that we're only taking the data part of the JSON and excluding the metadata.
  const noaaData: NOAAData[] = JSON.parse(stringifiedJson).data;

  // Create table headers and format them to stand out.
  let headers = [["Time", "Level"]];
  let headerRange = currentSheet.getRange("A1:B1");
  headerRange.setValues(headers);
  headerRange.getFormat().getFill().setColor("#4472C4");
  headerRange.getFormat().getFont().setColor("white");

  // Insert all the data in rows from JSON.
  let noaaDataCount = noaaData.length;
  let dataToEnter = [[], []]
  for (let i = 0; i < noaaDataCount; i++) {
    let currentDataPiece = noaaData[i];
    dataToEnter[i] = [currentDataPiece.t, currentDataPiece.v];
  }

  let dataRange = currentSheet.getRange("A2:B" + String(noaaDataCount + 1)); /* +1 to account for the title row */
  dataRange.setValues(dataToEnter);

  // Format the "Time" column for timestamps.
  dataRange.getColumn(0).setNumberFormatLocal("[$-en-US]mm/dd/yyyy hh:mm AM/PM;@");

  // Create and format a chart with the level data.
  let chart = currentSheet.addChart(ExcelScript.ChartType.xyscatterSmooth, dataRange);
  chart.getTitle().setText("Water Level - Seattle");
  chart.setTop(0);
  chart.setLeft(300);
  chart.setWidth(500);
  chart.setHeight(300);
  chart.getAxes().getValueAxis().setShowDisplayUnitLabel(false);
  chart.getAxes().getCategoryAxis().setTextOrientation(60);
  chart.getLegend().setVisible(false);

  // Add a comment with the data attribution.
  currentSheet.addComment(
    "A1",
    `This data was taken from the National Oceanic and Atmospheric Administration's Tides and Currents database on ${new Date(Date.now())}.`
  );

  /**
   * An interface to wrap the parts of the JSON we need.
   * These properties must match the names used in the JSON.
   */
  interface NOAAData {
    t: string; // Time
    v: number; // Level
  }
}
将脚本重命名为 NOAA 水位图 并保存。
运行脚本
在任何工作表上,运行 NOAA 水位图 脚本。 该脚本提取 2020 年 12 月 25 日至 2020 年 12 月 27 日的水位数据。 const可以更改脚本开头的变量以使用不同的日期或获取不同的工作站信息。 用于数据检索的 CO-OPS API 介绍了如何获取所有这些数据。
运行脚本后
