方案:Azure AI 服务 - 多变量异常情况检测
此方案演示了如何使用 Apache Spark 上的 SynapseML 和 Azure AI 服务进行多变量异常情况检测。 多变量异常情况检测允许检测多个变量或时序的异常情况,同时考虑到不同变量之间的所有相互关联和依赖关系。 在此方案中,我们使用 SynapseML 通过 Azure AI 服务训练多变量异常情况检测模型,然后使用该模型来推断包含来自三个 IoT 传感器的合成度量的数据集中的多变量异常情况。
重要
从 2023 年 9 月 20 日开始,将无法创建新的异常检测器资源。 异常检测器服务将于 2026 年 10 月 1 日停用。
若要详细了解 Azure AI 异常检测器,请参阅此文档页。
先决条件
- Azure 订阅 - 免费创建订阅
- 将笔记本附加到湖屋。 在左侧,选择“添加”以添加现有湖屋或创建湖屋。
安装
按照说明使用 Azure 门户创建 Anomaly Detector 资源,或者也可以使用 Azure CLI 创建此资源。
设置 Anomaly Detector 后,可以深入了解处理各种形式的数据的方法。 Azure AI 中的服务目录提供了多个选项:视觉、语音、语言、Web 搜索、判定、翻译和文档智能。
创建异常检测器资源
- 在 Azure 门户中,在资源组中选择创建,然后键入异常检测器。 选择“异常检测器”资源。
- 为资源命名,最好使用与资源组其余部分相同的区域。 使用其余选项的默认选项,然后选择“查看 + 创建”,然后选择“创建”。
- 创建异常检测器资源后,将其打开并选择左侧导航栏中的
Keys and Endpoints面板。 将异常检测器资源的密钥复制到ANOMALY_API_KEY环境变量中,或将其存储在anomalyKey变量中。
创建存储帐户资源
若要保存中间数据,则需要创建 Azure Blob 存储帐户。 在该存储帐户中,创建用于存储中间数据的容器。 记下容器名称,并将连接字符串复制到该容器。 稍后需要使用它来填充 containerName 变量和 BLOB_CONNECTION_STRING 环境变量。
输入服务密钥
让我们先为我们的服务密钥设置环境变量。 下一个单元格将根据存储在 Azure 密钥保管库中的值来设置 ANOMALY_API_KEY 和 BLOB_CONNECTION_STRING 环境变量。 如果你在自己的环境中运行本教程,请确保先设置这些环境变量,然后再继续。
import os
from pyspark.sql import SparkSession
from synapse.ml.core.platform import find_secret

# Bootstrap Spark Session
spark = SparkSession.builder.getOrCreate()
现在,让我们读取 ANOMALY_API_KEY 和 BLOB_CONNECTION_STRING 环境变量并设置 containerName 和 location 变量。
# An Anomaly Dectector subscription key
anomalyKey = find_secret("anomaly-api-key") # use your own anomaly api key
# Your storage account name
storageName = "anomalydetectiontest" # use your own storage account name
# A connection string to your blob storage account
storageKey = find_secret("madtest-storage-key") # use your own storage key
# A place to save intermediate MVAD results
intermediateSaveDir = (
    "wasbs://madtest@anomalydetectiontest.blob.core.windows.net/intermediateData"
)
# The location of the anomaly detector resource that you created
location = "westus2"
首先,连接到存储帐户,以便异常检测器可以保存中间结果:
spark.sparkContext._jsc.hadoopConfiguration().set(
    f"fs.azure.account.key.{storageName}.blob.core.windows.net", storageKey
)
让我们导入所有必要的模块。
import numpy as np
import pandas as pd

import pyspark
from pyspark.sql.functions import col
from pyspark.sql.functions import lit
from pyspark.sql.types import DoubleType
import matplotlib.pyplot as plt

import synapse.ml
from synapse.ml.cognitive import *
现在,让我们将示例数据读入 Spark 数据帧。
df = (
    spark.read.format("csv")
    .option("header", "true")
    .load("wasbs://publicwasb@mmlspark.blob.core.windows.net/MVAD/sample.csv")
)

df = (
    df.withColumn("sensor_1", col("sensor_1").cast(DoubleType()))
    .withColumn("sensor_2", col("sensor_2").cast(DoubleType()))
    .withColumn("sensor_3", col("sensor_3").cast(DoubleType()))
)

# Let's inspect the dataframe:
df.show(5)
现在,我们可以创建一个 estimator 对象,用于训练模型。 我们指定训练数据的开始和结束时间。 我们还指定要使用的输入列,以及包含时间戳的列的名称。 最后,指定要在异常情况检测滑动窗口中使用的数据点数,并将连接字符串设置为 Azure Blob 存储帐户。
trainingStartTime = "2020-06-01T12:00:00Z"
trainingEndTime = "2020-07-02T17:55:00Z"
timestampColumn = "timestamp"
inputColumns = ["sensor_1", "sensor_2", "sensor_3"]

estimator = (
    FitMultivariateAnomaly()
    .setSubscriptionKey(anomalyKey)
    .setLocation(location)
    .setStartTime(trainingStartTime)
    .setEndTime(trainingEndTime)
    .setIntermediateSaveDir(intermediateSaveDir)
    .setTimestampCol(timestampColumn)
    .setInputCols(inputColumns)
    .setSlidingWindow(200)
)
我们已经创建了 estimator,现在让我们将其与数据拟合:
model = estimator.fit(df)
```parameter

Once the training is done, we can now use the model for inference. The code in the next cell specifies the start and end times for the data we would like to detect the anomalies in.

```python
inferenceStartTime = "2020-07-02T18:00:00Z"
inferenceEndTime = "2020-07-06T05:15:00Z"

result = (
    model.setStartTime(inferenceStartTime)
    .setEndTime(inferenceEndTime)
    .setOutputCol("results")
    .setErrorCol("errors")
    .setInputCols(inputColumns)
    .setTimestampCol(timestampColumn)
    .transform(df)
)

result.show(5)
在上一个单元格中调用 .show(5) 时,它向我们显示了数据帧中的前五行。 结果是全部 null 的,因为它们不在推理窗口中。
若要仅显示推理数据的结果,请选择所需的列。 然后,我们可以按升序对数据帧中的行进行排序,并将结果筛选为仅显示推理窗口范围内的行。 在我们的示例中,inferenceEndTime 与数据帧中的最后一行相同,因此可以忽略它。
最后,为了能够更好地绘制结果,让我们将 Spark 数据帧转换为 Pandas 数据帧。
rdf = (
    result.select(
        "timestamp",
        *inputColumns,
        "results.contributors",
        "results.isAnomaly",
        "results.severity"
    )
    .orderBy("timestamp", ascending=True)
    .filter(col("timestamp") >= lit(inferenceStartTime))
    .toPandas()
)

rdf
设置 contributors 列的格式,该列将每个传感器的贡献分数存储到检测到的异常中。 下一个单元格将设置此数据的格式,并将每个传感器的贡献分数拆分为各自的列。
def parse(x):
    if type(x) is list:
        return dict([item[::-1] for item in x])
    else:
        return {"series_0": 0, "series_1": 0, "series_2": 0}

rdf["contributors"] = rdf["contributors"].apply(parse)
rdf = pd.concat(
    [rdf.drop(["contributors"], axis=1), pd.json_normalize(rdf["contributors"])], axis=1
)
rdf
很好! 现在,我们的 series_0、series_1 和 series_2 列中分别有传感器 1、2 和 3 的贡献分数。
运行下一个单元格来绘制结果。 minSeverity 参数指定要绘制的异常的最低严重程度。
minSeverity = 0.1

####### Main Figure #######
plt.figure(figsize=(23, 8))
plt.plot(
    rdf["timestamp"],
    rdf["sensor_1"],
    color="tab:orange",
    linestyle="solid",
    linewidth=2,
    label="sensor_1",
)
plt.plot(
    rdf["timestamp"],
    rdf["sensor_2"],
    color="tab:green",
    linestyle="solid",
    linewidth=2,
    label="sensor_2",
)
plt.plot(
    rdf["timestamp"],
    rdf["sensor_3"],
    color="tab:blue",
    linestyle="solid",
    linewidth=2,
    label="sensor_3",
)
plt.grid(axis="y")
plt.tick_params(axis="x", which="both", bottom=False, labelbottom=False)
plt.legend()

anoms = list(rdf["severity"] >= minSeverity)
_, _, ymin, ymax = plt.axis()
plt.vlines(np.where(anoms), ymin=ymin, ymax=ymax, color="r", alpha=0.8)

plt.legend()
plt.title(
    "A plot of the values from the three sensors with the detected anomalies highlighted in red."
)
plt.show()

####### Severity Figure #######
plt.figure(figsize=(23, 1))
plt.tick_params(axis="x", which="both", bottom=False, labelbottom=False)
plt.plot(
    rdf["timestamp"],
    rdf["severity"],
    color="black",
    linestyle="solid",
    linewidth=2,
    label="Severity score",
)
plt.plot(
    rdf["timestamp"],
    [minSeverity] * len(rdf["severity"]),
    color="red",
    linestyle="dotted",
    linewidth=1,
    label="minSeverity",
)
plt.grid(axis="y")
plt.legend()
plt.ylim([0, 1])
plt.title("Severity of the detected anomalies")
plt.show()

####### Contributors Figure #######
plt.figure(figsize=(23, 1))
plt.tick_params(axis="x", which="both", bottom=False, labelbottom=False)
plt.bar(
    rdf["timestamp"], rdf["series_0"], width=2, color="tab:orange", label="sensor_1"
)
plt.bar(
    rdf["timestamp"],
    rdf["series_1"],
    width=2,
    color="tab:green",
    label="sensor_2",
    bottom=rdf["series_0"],
)
plt.bar(
    rdf["timestamp"],
    rdf["series_2"],
    width=2,
    color="tab:blue",
    label="sensor_3",
    bottom=rdf["series_0"] + rdf["series_1"],
)
plt.grid(axis="y")
plt.legend()
plt.ylim([0, 1])
plt.title("The contribution of each sensor to the detected anomaly")
plt.show()

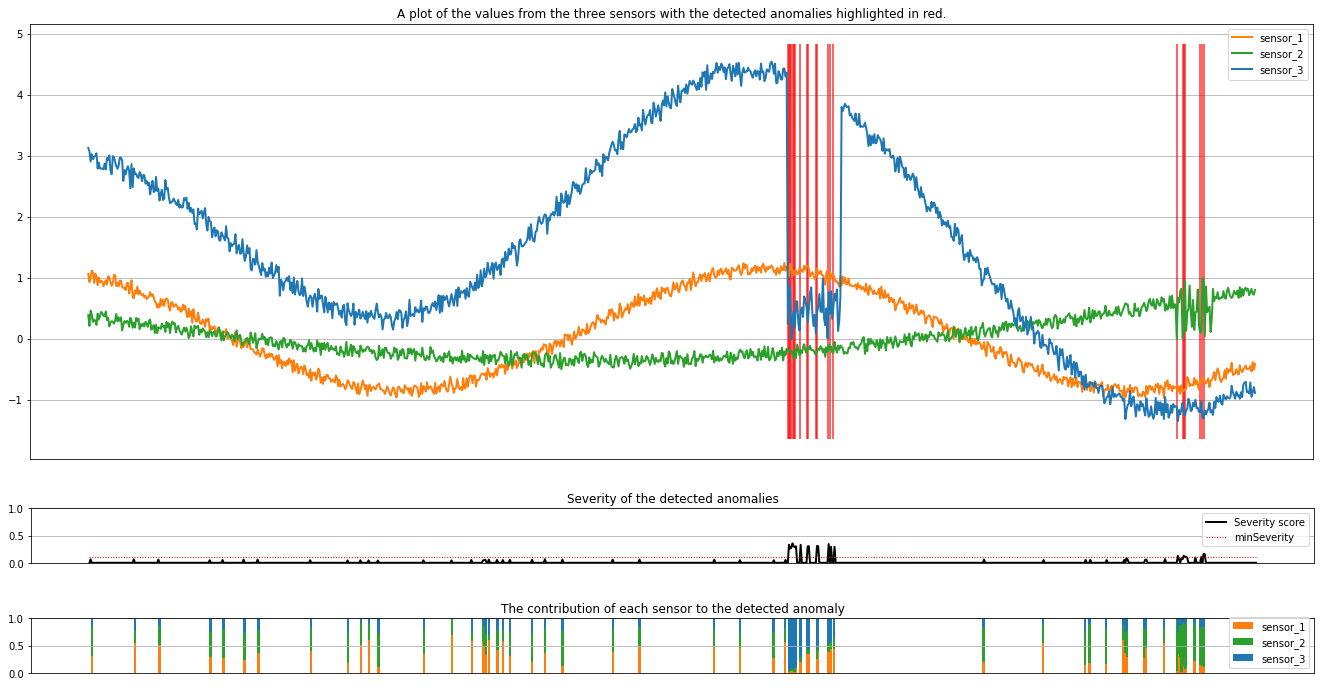
绘图以橙色、绿色和蓝色显示来自传感器(推理窗口内)的原始数据。 第一张图中的红色竖线显示检测到的异常,其严重程度大于或等于 minSeverity。
第二张图显示所有检测到的异常的严重程度分数,阈值 minSeverity 以红色虚线显示。
最后,最后一张图显示每个传感器的数据对检测到的异常的贡献。 它帮助我们诊断和了解每个异常最可能的原因。