调试 StackOverflow 错误
执行堆栈溢出时会引发 StackOverflowException,因为它包含过多的嵌套方法调用。 出现这种情况的原因往往是方法之间相互递归调用。
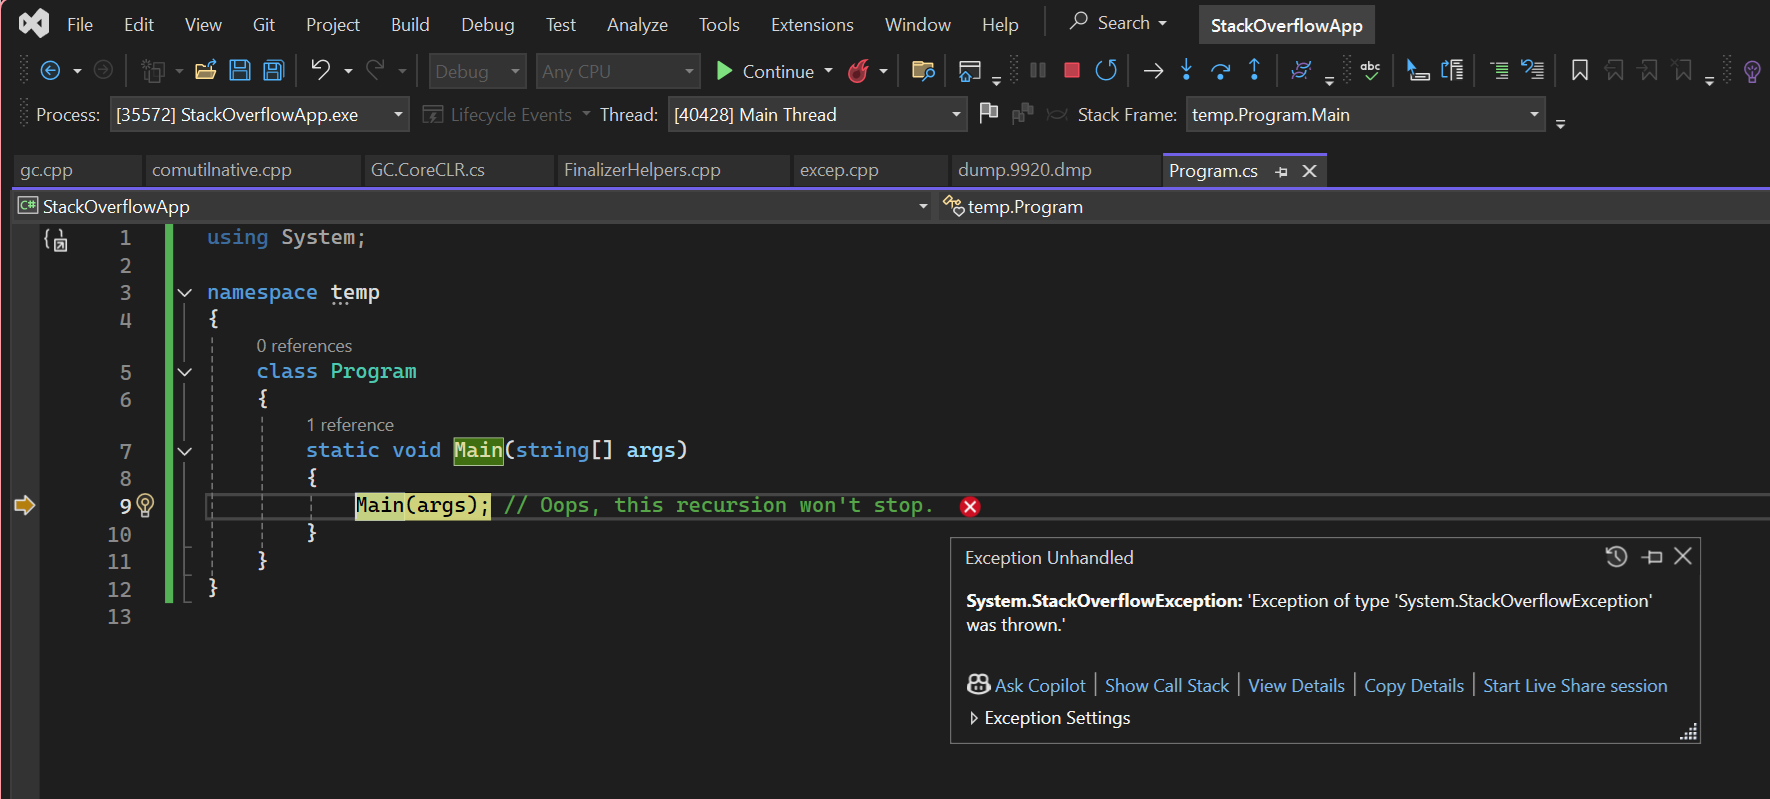
例如,假设你有一个应用,如下所示:
using System;

namespace temp
{
    class Program
    {
        static void Main(string[] args)
        {
            Main(args); // Oops, this recursion won't stop.
        }
    }
}
Main 方法将持续调用自身,直到没有更多的堆栈空间。 一旦没有更多的堆栈空间,执行将无法继续,因此它将引发 StackOverflowException。
> dotnet run
Stack overflow.
   at temp.Program.Main(System.String[])
   at temp.Program.Main(System.String[])
   at temp.Program.Main(System.String[])
   at temp.Program.Main(System.String[])
   at temp.Program.Main(System.String[])
   at temp.Program.Main(System.String[])
   <this output repeats many more times>
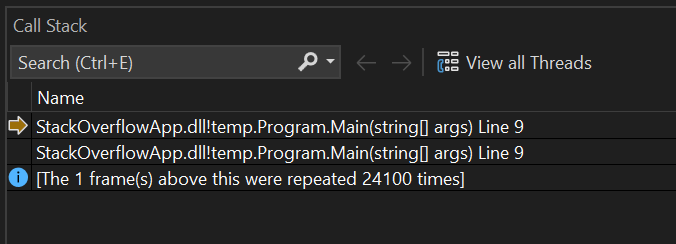
看到程序退出并显示如下所示的输出时,可以找到重复方法的源代码,并调查导致大量调用的逻辑。
使用调试器
通常,在上面的主机上看到此调用堆栈足以识别有问题的代码。 但是,如果问题仍然不清楚,可以进一步调试。
此示例在发生 StackOverflowException 时创建核心转储,然后将转储加载到 lldb(常见的 Linux 命令行调试器)并对其进行调试。
运行应用并将其配置为在发生故障时收集转储。
> export DOTNET_DbgEnableMiniDump=1
> dotnet run
Stack overflow.
Writing minidump with heap to file /tmp/coredump.6412
Written 58191872 bytes (14207 pages) to core file
注意
.NET 6 将用于配置 .NET 运行时行为的环境变量的前缀标准化为
DOTNET_,而不再使用COMPlus_。 但是,COMPlus_前缀仍可继续使用。 如果使用的是 .NET 运行时的早期版本,则仍应对环境变量使用COMPlus_前缀。使用 dotnet-sos安装 SOS 扩展。
dotnet-sos install在 lldb 中打开转储文件,并使用
bt(回溯)命令显示堆栈。lldb --core /temp/coredump.6412 (lldb) bt ... frame #261930: 0x00007f59b40900cc frame #261931: 0x00007f59b40900cc frame #261932: 0x00007f59b40900cc frame #261933: 0x00007f59b40900cc frame #261934: 0x00007f59b40900cc frame #261935: 0x00007f5a2d4a080f libcoreclr.so`CallDescrWorkerInternal at unixasmmacrosamd64.inc:867 frame #261936: 0x00007f5a2d3cc4c3 libcoreclr.so`MethodDescCallSite::CallTargetWorker(unsigned long const*, unsigned long*, int) at callhelpers.cpp:70 frame #261937: 0x00007f5a2d3cc468 libcoreclr.so`MethodDescCallSite::CallTargetWorker(this=<unavailable>, pArguments=0x00007ffe8222e7b0, pReturnValue=0x0000000000000000, cbReturnValue=0) at callhelpers.cpp:604 frame #261938: 0x00007f5a2d4b6182 libcoreclr.so`RunMain(MethodDesc*, short, int*, PtrArray**) [inlined] MethodDescCallSite::Call(this=<unavailable>, pArguments=<unavailable>) at callhelpers.h:468 ...顶部帧
0x00007f59b40900cc被多次重复。 使用 SOSip2md命令确定托管方法所在的0x00007f59b40900cc地址。(lldb) ip2md 0x00007f59b40900cc MethodDesc: 00007f59b413ffa8 Method Name: temp.Program.Main(System.String[]) Class: 00007f59b4181d40 MethodTable: 00007f59b4190020 mdToken: 0000000006000001 Module: 00007f59b413dbf8 IsJitted: yes Current CodeAddr: 00007f59b40900a0 Version History: ILCodeVersion: 0000000000000000 ReJIT ID: 0 IL Addr: 0000000000000000 CodeAddr: 00007f59b40900a0 (MinOptJitted) NativeCodeVersion: 0000000000000000 Source file: /temp/Program.cs @ 9查看指示的方法 temp.Program.Main(System.String[]) 和来源 "/temp/Program.cs @ 9",看看你能否找出代码哪里出了问题。 如果需要其他信息,可以使用进一步调试器或 SOS 命令来检查该过程。