你当前正在访问 Microsoft Azure Global Edition 技术文档网站。 如果需要访问由世纪互联运营的 Microsoft Azure 中国技术文档网站,请访问 https://docs.azure.cn。
Tutorial: Build a Java metrics dashboard with Azure Managed Grafana
In this tutorial, you will learn how to set up a metrics dashboard using Azure Managed Grafana to monitor Java applications running in Azure Container Apps.
Grafana is a popular tool for centralized metrics visualization and monitoring in the observability industry. Azure Managed Grafana is a fully managed Azure service that allows you to deploy and manage Grafana dashboards with seamless Azure integration. You can use Azure Managed Grafana to visualize Java metrics exposed by Azure Container Apps or integrate Java metrics into your existing Grafana dashboards.
In this tutorial, you:
- Create an Azure Managed Grafana instance.
- Create a Java metrics dashboard in Grafana.
- Visualize Java metrics for Azure Container Apps with Grafana.
Prerequisites
- An Azure account with an active subscription. If you don't already have one, you can can create one for free.
- Azure CLI.
- A Java application deployed in Azure Container Apps.
Set up the environment
Use the following steps to define environment variables and ensure your Azure Managed Grafana extension is up to date.
Create variables to support your Grafana configuration.
export LOCATION=eastus
export SUBSCRIPTION_ID={subscription-id}
export RESOURCE_GROUP=grafana-resource-group
export GRAFANA_INSTANCE_NAME=grafana-name
Variable Description LOCATIONThe Azure region location where you create your Azure Managed Grafana instance. SUBSCRIPTION_IDThe subscription ID which you use to create your Azure Container Apps and Azure Managed Grafana instance. RESOURCE_GROUPThe Azure resource group name for your Azure Managed Grafana instance. GRAFANA_INSTANCE_NAMEThe instance name for your Azure Managed Grafana instance. Log in to Azure with the Azure CLI.
az loginCreate a resource group.
az group create --name $RESOURCE_GROUP --location $LOCATIONUse the following command to ensure that you have the latest version of the Azure CLI extensions for Azure Managed Grafana.
az extension add --name amg --upgrade
Set up an Azure Managed Grafana instance
First, create an Azure Managed Grafana instance, and grant necessary role assignments.
Create an Azure Managed Grafana instance.
az grafana create \
    --name $GRAFANA_INSTANCE_NAME \
    --resource-group $RESOURCE_GROUP \
    --location $LOCATION
Grant the Azure Managed Grafana instance "Monitoring Reader" role to read metrics from Azure Monitor. Find more about the authentication and permissions for Azure Managed Grafana.
GRAFA_IDDENTITY=$(az grafana show --name $GRAFANA_INSTANCE_NAME --resource-group $RESOURCE_GROUP --query "identity.principalId" --output tsv)

az role assignment create --assignee $GRAFA_IDDENTITY --role "Monitoring Reader" --scope /subscriptions/$SUBSCRIPTION_ID
Create a Java metrics dashboard
Important
To add a new dashboard in Grafana, you need to have Grafana Admin or Grafana Editorrole, see Azure Managed Grafana roles.
Assign the
Grafana Adminrole to your account on the Azure Managed Grafana resource.Get the resource ID for your Azure Managed Grafana instance.
GRAFANA_RESOURCE_ID=$(az grafana show --resource-group $RESOURCE_GROUP --name $GRAFANA_INSTANCE_NAME --query id --output tsv)Before running this command, replace the
<USER_OR_SERVICE_PRINCIPAL_ID>placeholder with your user or service principal ID.az role assignment create \ --assignee <USER_OR_SERVICE_PRINCIPAL_ID> \ --role "Grafana Admin" \ --scope $GRAFANA_RESOURCE_IDDownload the sample Java metric dashboard for Azure Container Apps json file.
Get the endpoint of the Azure Managed Grafana resource.
az grafana show --resource-group $RESOURCE_GROUP \
   --name $GRAFANA_INSTANCE_NAME \
   --query "properties.endpoint" \
   --output tsv
This command returns the URL you can use to access the Azure Managed Grafana dashboard. Open your browser with URL and login.
Go to
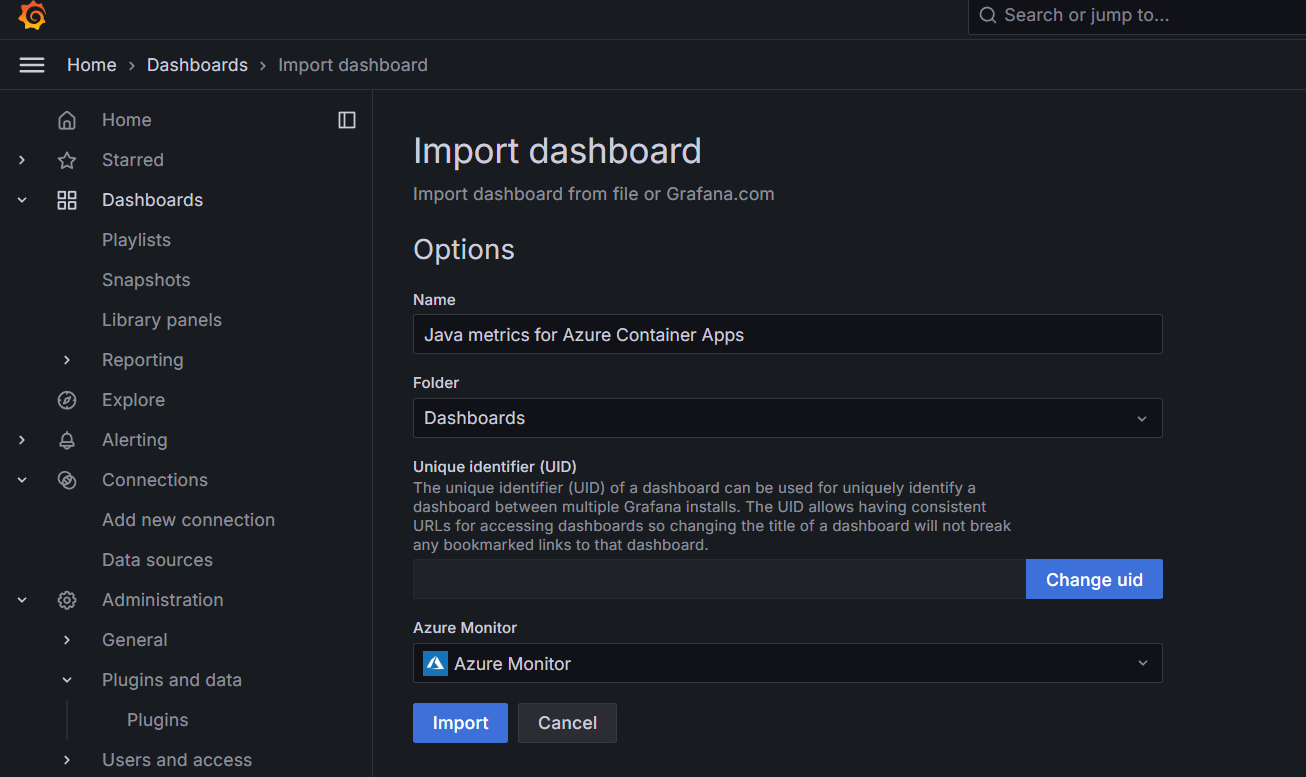
Dashboard>New->Import. Upload the above sample dashboard JSON file, and choose the default built-inAzure Monitordata source, then clickImportbutton.
Visualize Java metrics for Azure Container Apps with Grafana
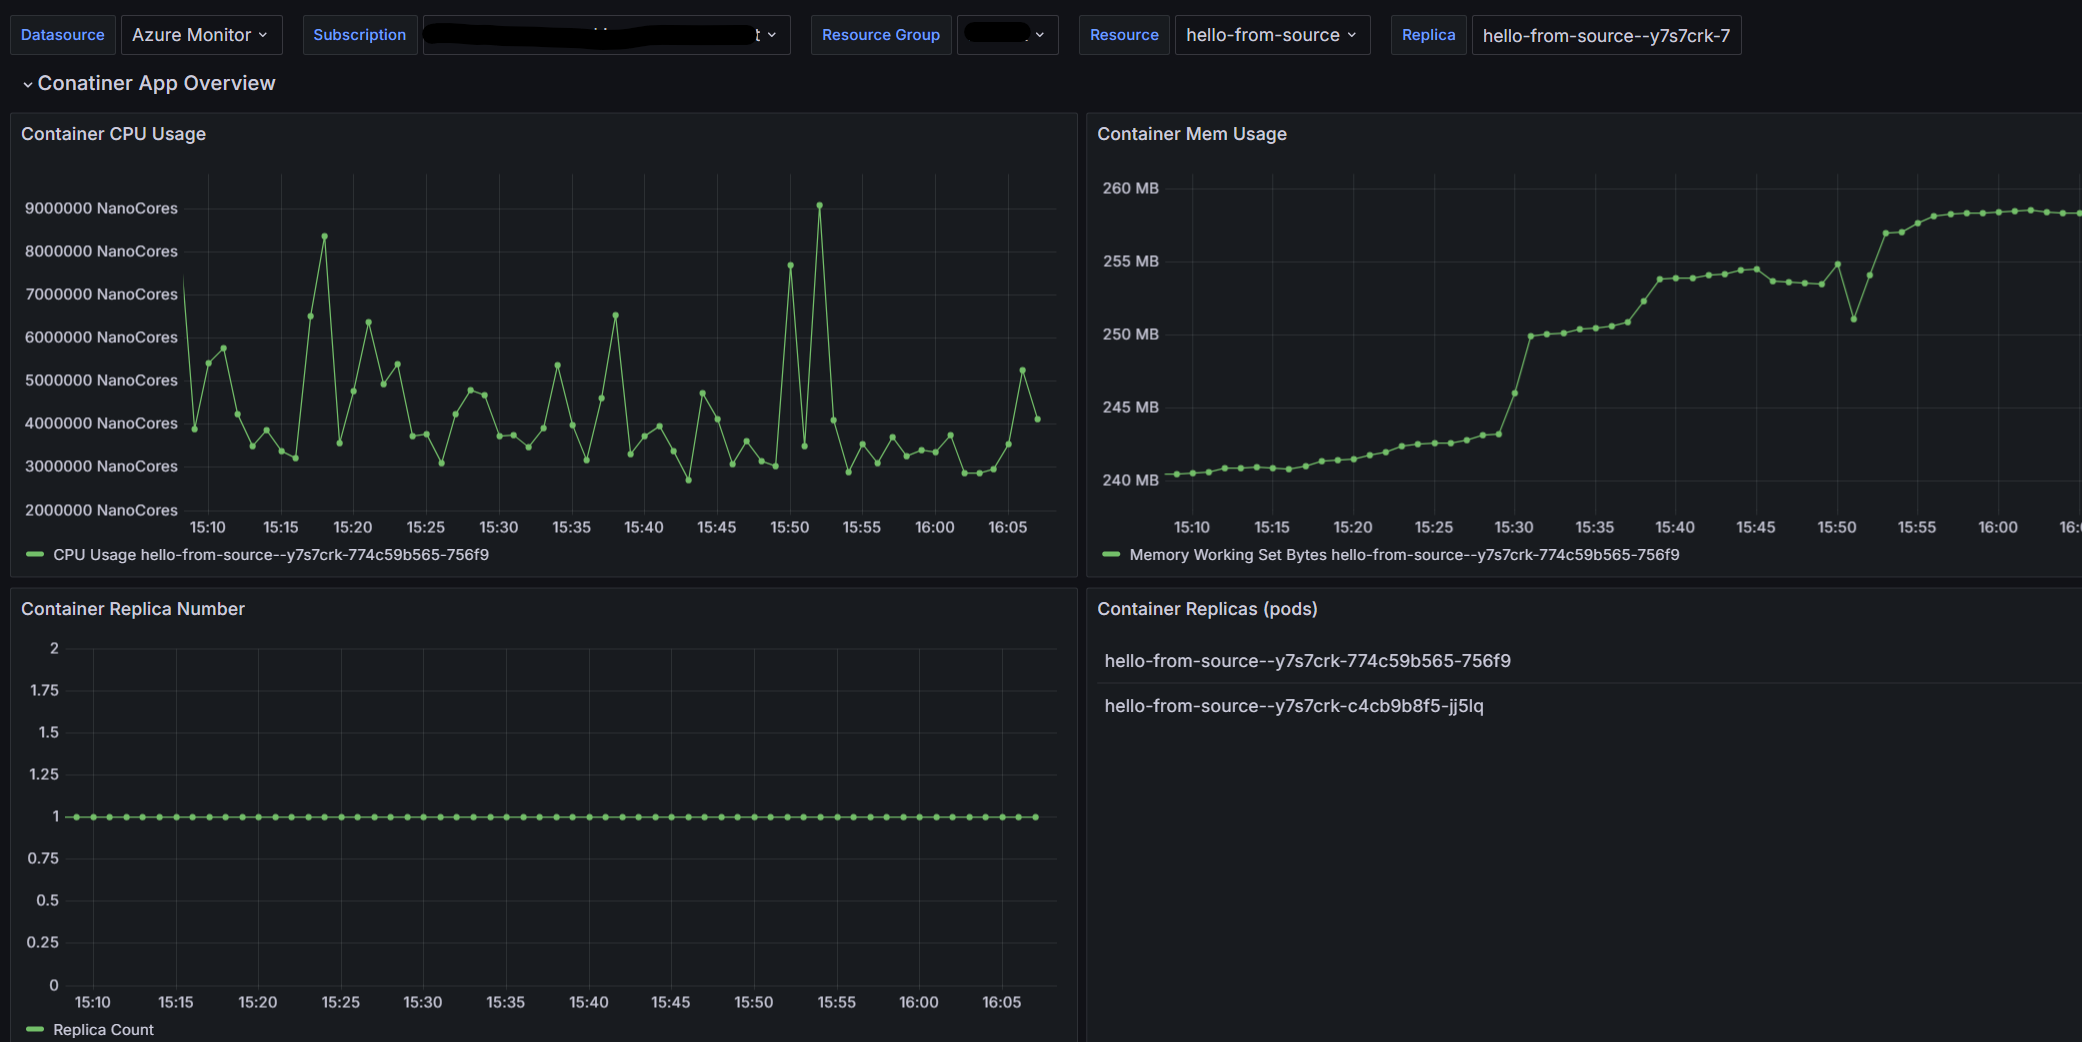
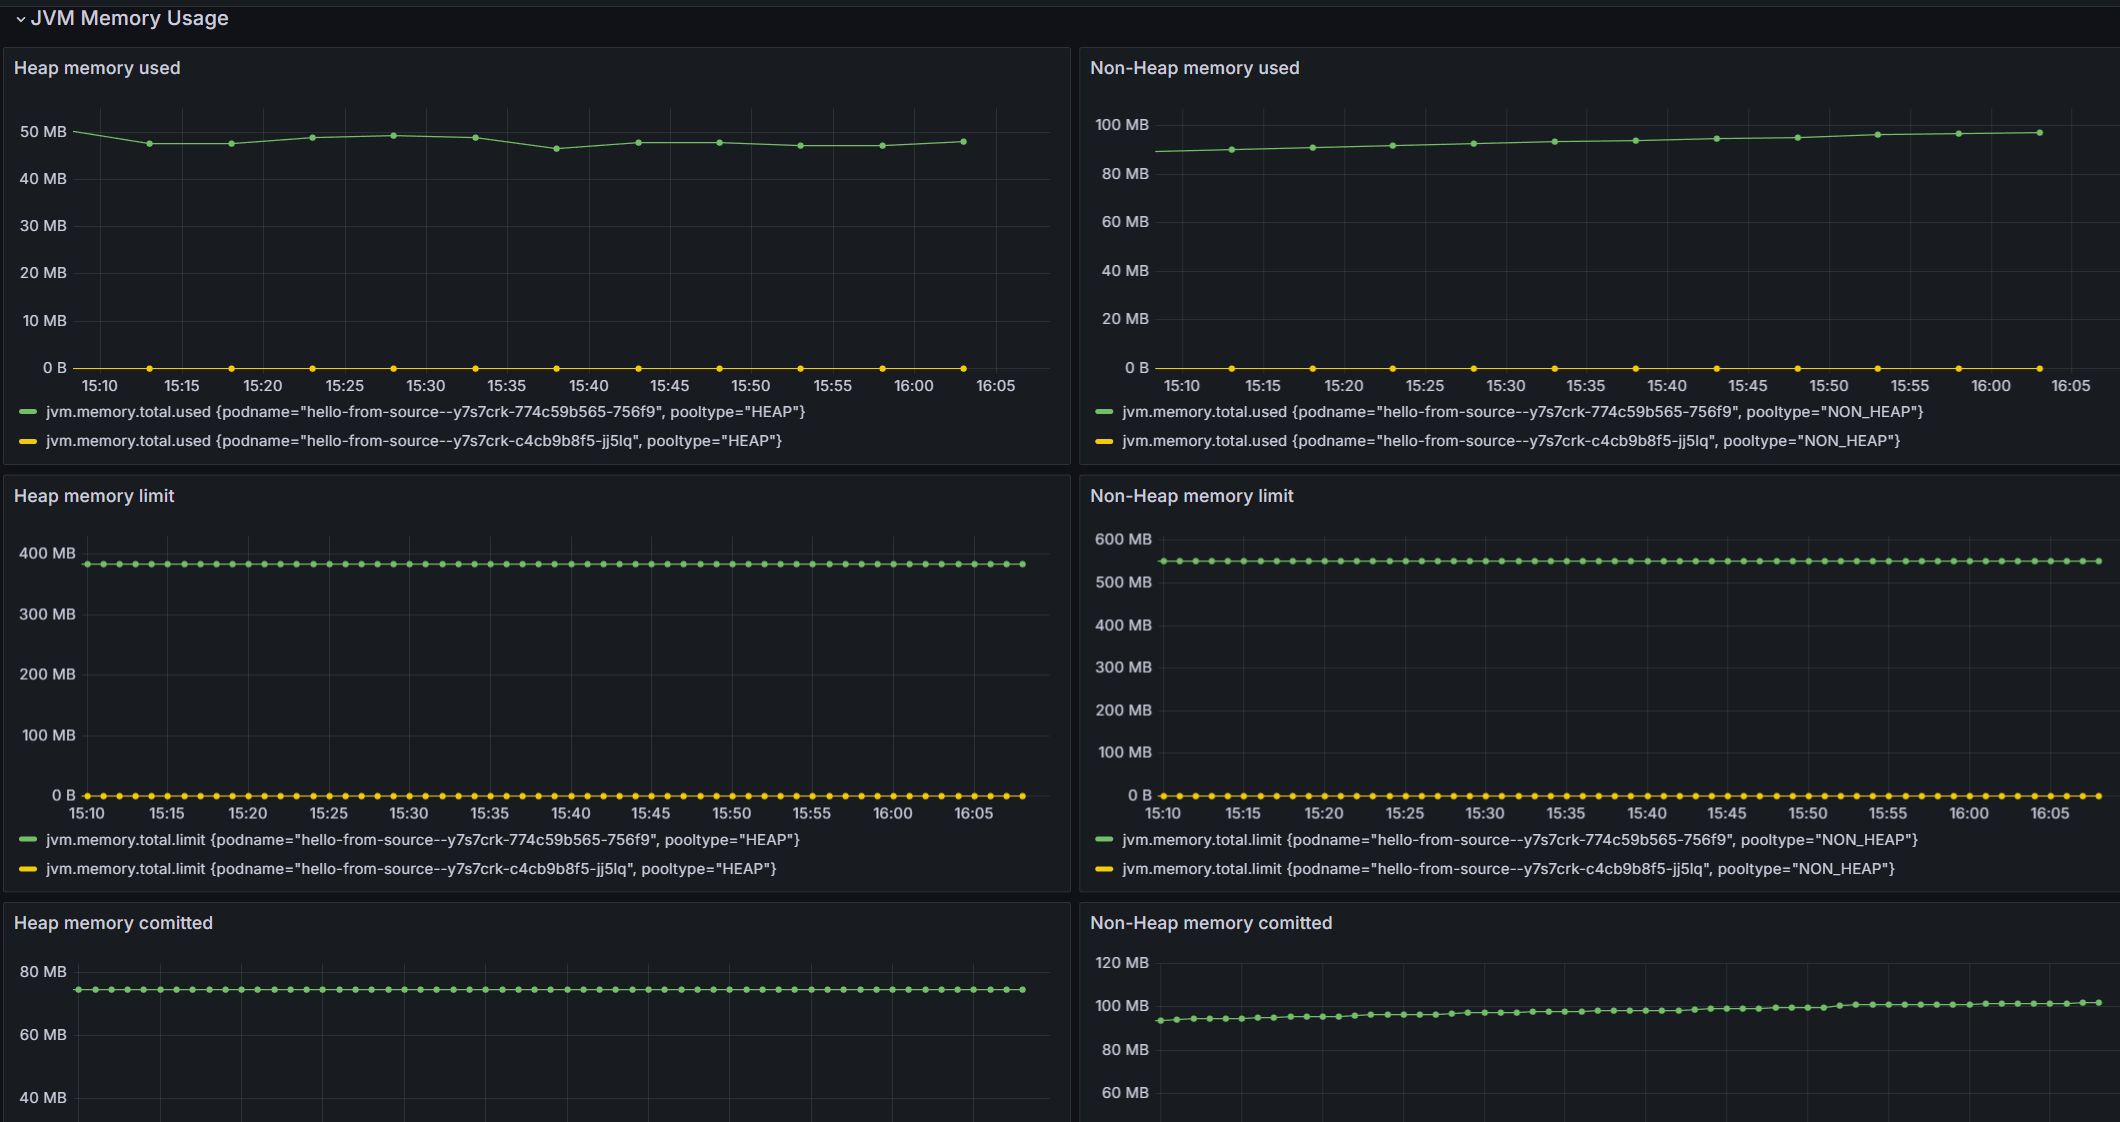
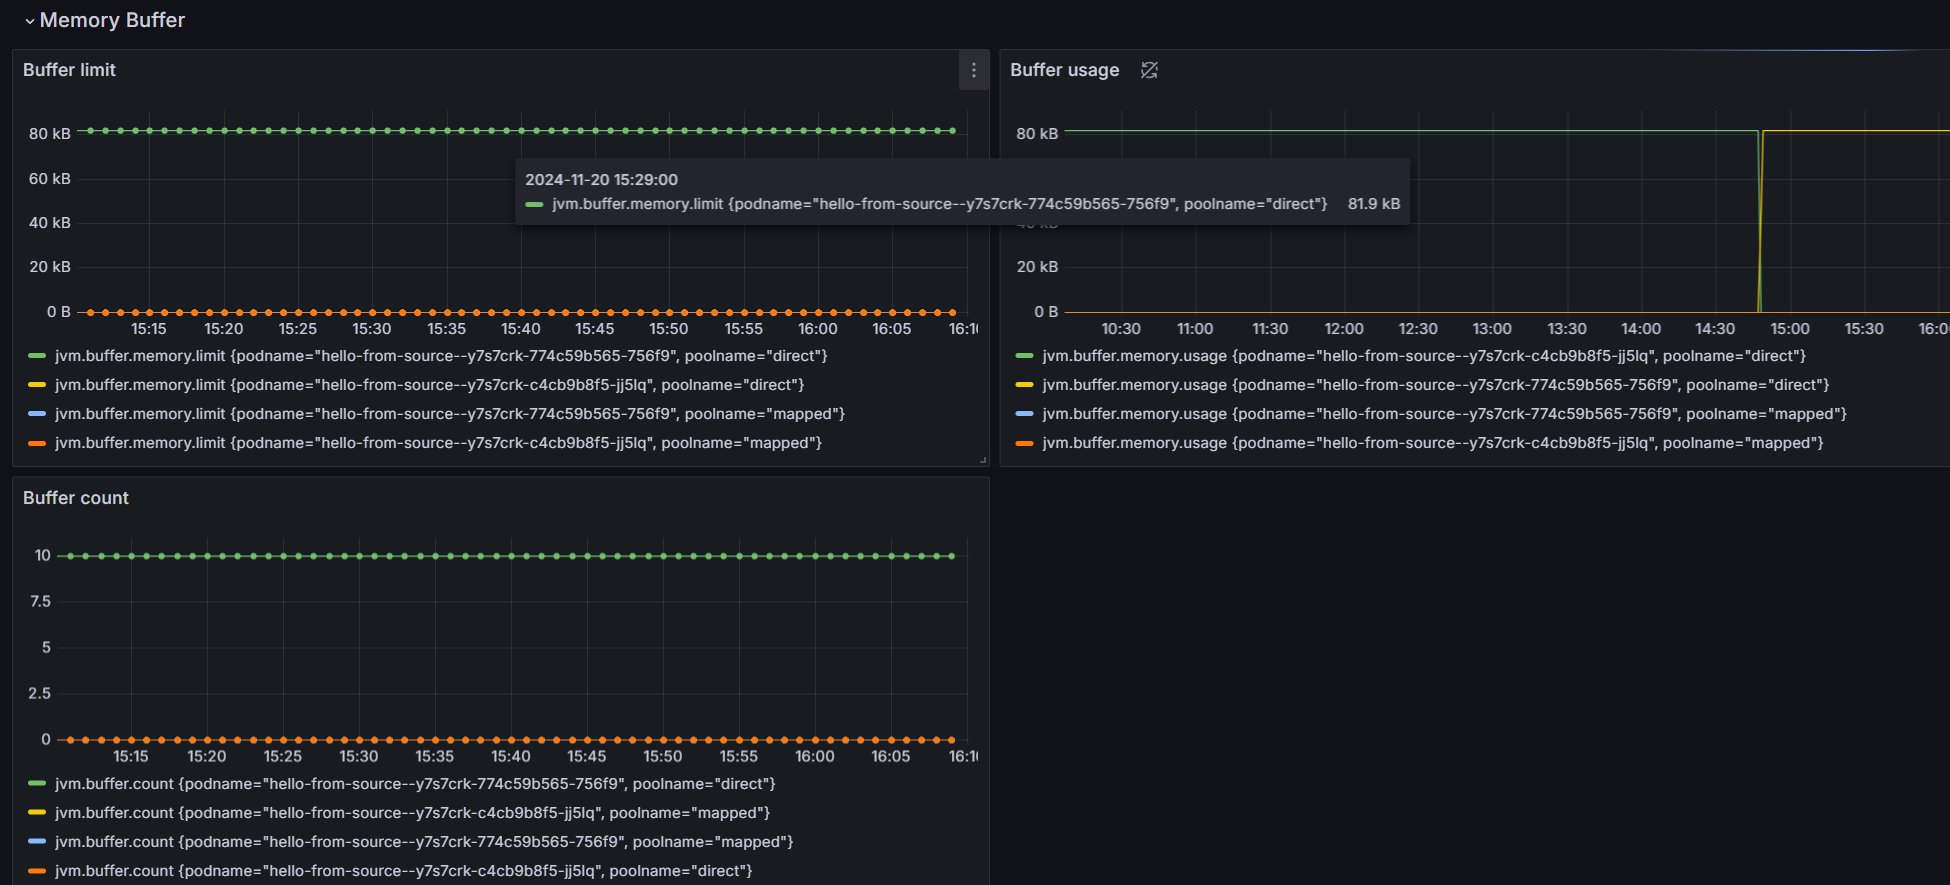
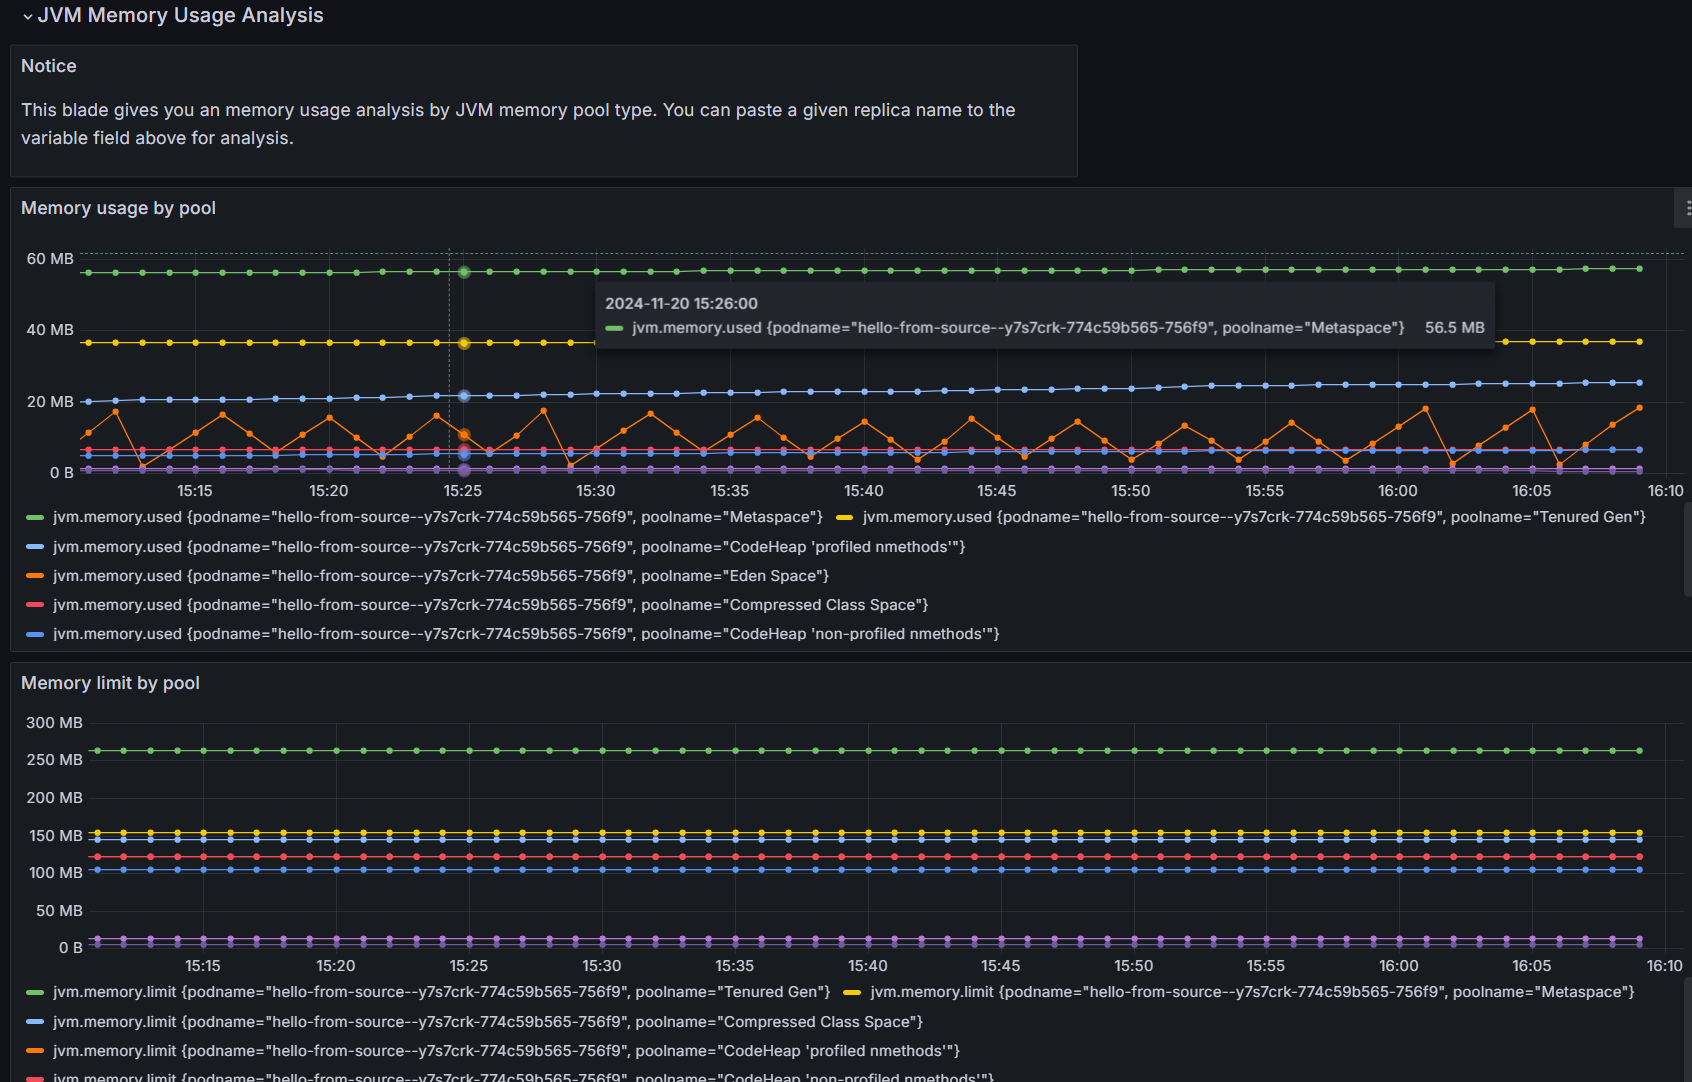
Input your resource information in the filters for your Azure Container Apps. Now you can view all the supported Java metrics in Azure Container Apps within the dashboard. The sample dashboard provides live metric data, including
- Container App Overview
- JVM Memory Usage
- JVM Memory Buffer
- JVM GC JVM GC
- A detailed JVM Memory Usage Analysis
You can use this dashboard as a starting point to create your own customized metric visualizations and monitoring solution.
Clean up resources
The resources created in this tutorial have an effect on your Azure bill. If you aren't going to use these services long-term, run the following command to remove everything created in this tutorial.
az group delete --resource-group $RESOURCE_GROUP
