How the Concurrency Visualizer Represents Recycled Thread IDs
If you are profiling an application spawning hundred’s of threads, you may see some thread IDs with #<int> suffixes in the Concurrency Visualizer. This is merely how the Concurrency Visualizer displays recycled thread IDs.
While parsing the ETW events for the process being profiled, the visualizer looks for the thread start/end events. I used xperf to drill further into the ETW events in the ETL file collected by the Concurrency Visualizer. Here are some snippets from the xperf output (a csv file listing all the events collected in the ETL log):
T-Start, 1144863, application1.exe ( 572), 5868, …
T-End, 1155571, application1.exe ( 572), 5868, ….
T-Start, 37311946, application1.exe ( 572), 5868, …
T-End, 37361583, application1.exe ( 572), 5868, …
Here, the T-Start and T-End represent the thread start and thread end events. You can clearly see that thread ID 5868 has been assigned to two different threads within the same process application1.exe(Process ID 572).
In such cases, the Concurrency Visualizer will show the threads in separate channels. To distinguish the two threads, the thread ID entry is represented as “ThreadID#<int>”, where the integer suffix is the thread ID reuse count. The thread ID may be recycled multiple times within the same process: the integer suffix is incremented for each thread instance.
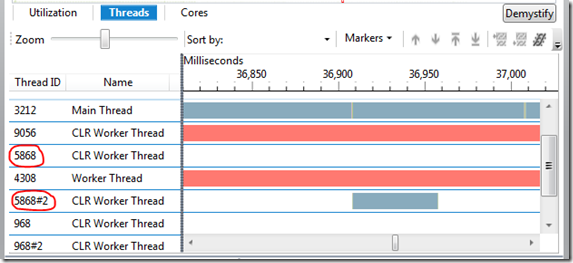
Refer to the following Threads View screenshot in the Concurrency Visualizer:
Thread IDs 5868 and 968 are being recycled. The channels with Thread ID 5868#2 and 968#2 represent the second threads reusing the same thread IDs.
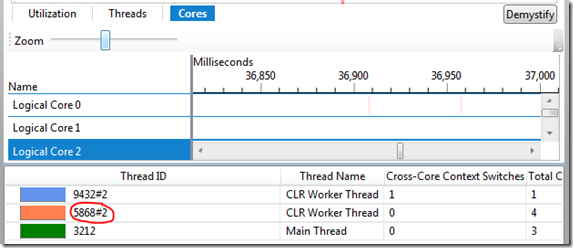
The Cores View legend also visualizes the threads with the “ThreadID#<int>” representation. A sample view:
Next time you bump into these weird numbers with the #2, #3.. suffixes, you know what they mean. Happy profiling!

