SQL 2005 (SQL 2008) Analysis Services Server Side Tracing
With Analysis Services 2005 (2008) you can collect traces without using gui this feature is known as Server Side Tracing.
In this article we’ll talk about how to achieve Server Side Tracing.
How to create a Server Side Trace
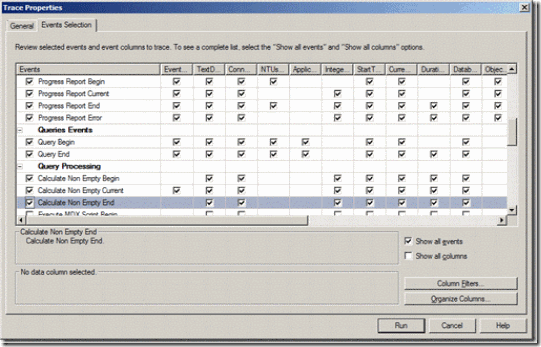
- Open SQL Server profiler connect to Analysis Services and in an Event Selection define the SSAS Events.
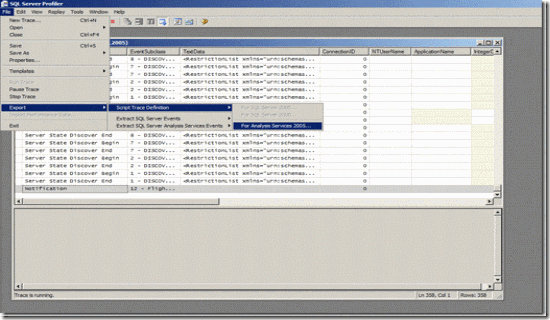
- Next script the trace by going to "File – Export – Script Trace Definition – For Analysis Services 2005 (AS 2005 and 2008 in case of 2008)".
- Open the Script file in Notepad and cut and copy the Events and Filter Elements to below mentioned script.
<!--Copy this Script file in Notepad and Replace Events and Filters Elements with the elements which you had generated from Trace Definition file—> <Batch xmlns="https://schemas.microsoft.com/analysisservices/2003/engine" xmlns:soap="https://schemas.xmlsoap.org/soap/envelope/"> <Create xmlns="https://schemas.microsoft.com/analysisservices/2003/engine"> <ObjectDefinition> <Trace> <ID>DBA Performance Trace</ID> <Name>DBA Performance Trace</Name> <!--UPDATE YOUR OUTPUT PATH!!!!!!!--> <LogFileName>C:\OLAP_TRACE.trc</LogFileName> <LogFileAppend>1</LogFileAppend> <AutoRestart>0</AutoRestart> <!--Logfilesize is in MB--> <LogFileSize>5000</LogFileSize> <LogFileRollover>1</LogFileRollover> <!-- Uncomment and upade stoptime if you want to auto stop --> <!--StopTime>...</StopTime—> <Events> <!--Add Events from the Trace Definition File—> </Events> <Filter> <!--Add If you have defined any filters then add it here—> </Filter> </Trace> </ObjectDefinition> </Create> </Batch> |
After Making Changes Script Will Look Something Like this. <Batch xmlns="https://schemas.microsoft.com/analysisservices/2003/engine" xmlns:soap="https://schemas.xmlsoap.org/soap/envelope/"> <Create xmlns="https://schemas.microsoft.com/analysisservices/2003/engine"> <ObjectDefinition> <Trace> <ID>DBA Performance Trace</ID> <Name>DBA Performance Trace</Name> <!--UPDATE YOUR OUTPUT PATH!!!!!!!--> <LogFileName>C:\OLAP.trc</LogFileName> <LogFileAppend>1</LogFileAppend> <AutoRestart>0</AutoRestart> <!--Logfilesize is in MB--> <LogFileSize>5000</LogFileSize> <LogFileRollover>1</LogFileRollover> <!-- Uncomment and upade stoptime if you want to auto stop --> <!--StopTime>...</StopTime--> <Events> <Event> <EventID>15</EventID> <Columns> <ColumnID>28</ColumnID> <ColumnID>32</ColumnID> <ColumnID>36</ColumnID> </Columns> </Event> <Event> <EventID>16</EventID> <Columns> <ColumnID>24</ColumnID> <ColumnID>32</ColumnID> <ColumnID>1</ColumnID> </Columns> </Event> </Events> <Filter> <NotLike> <ColumnID>37</ColumnID> <Value>SQL Server Profiler</Value> </NotLike> </Filter> </Trace> </ObjectDefinition> </Create> </Batch> |
Open Management Studio on Server or any Client box connect to Analysis Services then go to file –> New XMLA Command –> Copy this Script and Execute it, this will initiate Trace on Server.
How to Find out whether Script is Running
<!--This script will give you a list off all running traces—> <!—By Default you will get trace for Flight Recorder—> <Discover xmlns="urn:schemas-microsoft-com:xml-analysis"> <RequestType>DISCOVER_TRACES</RequestType> <Restrictions> <RestrictionList> </RestrictionList> </Restrictions> <Properties> <PropertyList> </PropertyList> </Properties> </Discover> |
How to Drop the Trace which you had created
<Delete xmlns=https://schemas.microsoft.com/analysisservices/2003/engine xmlns:soap="https://schemas.xmlsoap.org/soap/envelope/"> <Object> <TraceID>DBA Performance Trace</TraceID> </Object> </Delete> |
Note:
When you generate a trace definition using Profiler Trace it excludes LogFileName, LogSize etc, that is why I had suggested to use script which I had created.
Secondly, you need to define the stop time or you can drop the trace by giving above mentioned command (this will only stop the trace but will not physically drop the file).
This trace script file is amended from an example given in SSAS Processing Best Practices
By
Karan Gulati,
SE, Microsoft SQL Server Analysis Services
Comments
Anonymous
January 20, 2010
Thank you for the post. It's very helpful to me. Is it possible to specify Table in a database as Log destination, not log file as in your example ? I can't find information if it is possible and if yes - then how. SQL Server Profiler allows to save information to the database on Trace Properties dialog, but looks like this information is not passed to SSAS. Thank you, Taras BerezyukAnonymous
January 21, 2010
If you want to save our data in a table then i will recommend to use ASTrace utility. The ASTrace utility provides you with ability to capture an Analysis Services trace and log it into a SQL Server table. The table can be queried later or read using SQL Server Profiler. The ASTrace utility runs as a Windows service that connects to Analysis Services, then creates a trace, and logs trace events into a SQL Server table using the SQL Server Profiler format. The ASTrace utility creates the trace using a standard trace template that you can author using SQL Server Profiler. Here is the link http://msdn.microsoft.com/en-us/library/bb283156(SQL.90).aspxAnonymous
February 01, 2010
Is it possible to generate traces in plain text rather than binary?Anonymous
August 30, 2012
Excellent Article. Question: how to convert this file (resulting trace file) to table? any script I can use will be great! Thanks again for this great post.Anonymous
May 10, 2015
How make schedule trace ?

