Top 10 SQL Server Integration Services Best Practices
As of September 1, 2013 we decided to remove SQLCAT.COM site and use MSDN as the primary vehicle to post new SQL Server content. This was done to minimize reader confusion and to streamline content publication. MSDN SQLCAT blogs already includes most SQLCAT.COM Content and will continue to be updated with more SQLCAT learnings. You can also find a collection of our work in SQLCAT Guidance eBooks.
To make the transition to MSDN smoother, we are in the process of reposting a few of SQLCAT.COM’s blogs that are still being very actively viewed. Following is reposting of one of the SQLCAT.Com blogs that still draws huge interest. You can find this, and other guidance in the SQLCAT's Guide to BI and Analytics eBook.
Also, Follow us on Twitter as we normally use our Twitter handles @MSSQLCAT and @MSAzureCAT to announce news and new content.
Top 10 SQL Server integration Services Best Practices
How many of you have heard the myth that Microsoft® SQL Server® Integration Services (SSIS) does not scale? The first question we would ask in return is: "Does your system need to scale beyond 4.5 million sales transaction rows per second?" SQL Server Integration Services is a high performance Extract-Transform-Load (ETL) platform that scales to the most extreme environments. And as documented in SSIS ETL world record performance, SQL Server Integration Services can process at the scale of 4.5 million sales transaction rows per second.
1. |
SSIS is an in-memory pipeline, so ensure that all transformations occur in memory.The purpose of having Integration Services within SQL Server features is to provide a flexible, robust pipeline that can efficiently perform row-by-row calculations and parse data all in memory. While the extract and load phases of the pipeline will touch disk (read and write respectively), the transformation itself should process in memory. If transformations spill to disk (for example with large sort operations), you will see a big performance degradation. Construct your packages to partition and filter data so that all transformations fit in memory.A great way to check if your packages are staying within memory is to review the SSIS performance counter Buffers spooled, which has an initial value of 0; above 0 is an indication that the engine has started swapping to disk. For more information, please refer to Something about SSIS Performance Counters. |
2.
|
Plan for capacity by understanding resource utilization.SQL Server Integration Services is designed to process large amounts of data row by row in memory with high speed. Because of this, it is important to understand resource utilization, i.e., the CPU, memory, I/O, and network utilization of your packages. CPU BoundSeek to understand how much CPU is being used by Integration Services and how much CPU is being used overall by SQL Server while Integration Services is running. This latter point is especially important if you have SQL Server and SSIS on the same box, because if there is a resource contention between these two, it is SQL Server that will typically win – resulting in disk spilling from Integration Services, which slows transformation speed. The perfmon counter that is of primary interest to you is Process / % Processor Time (Total) . Measure this counter for both sqlservr.exe and dtexec.exe. If SSIS is not able to drive close to 100% CPU load, this may be indicative of:
Network BoundSSIS moves data as fast as your network is able to handle it. Because of this, it is important to understand your network topology and ensure that the path between your source and target have both low latency and high throughput. The following Network perfmon counters can help you tune your topology:
These counters enable you to analyze how close you are to the maximum bandwidth of the system. Understanding this will allow you to plan capacity appropriately whether by using gigabit network adapters, increasing the number of NIC cards per server, or creating separate network addresses specifically for ETL traffic. I/O BoundIf you ensure that Integration Services is minimally writing to disk, SSIS will only hit the disk when it reads from the source and writes to the target. But if your I/O is slow, reading and especially writing can create a bottleneck. Because tuning I/O is outside the scope of this technical note, please refer to Predeployment I/O Best Practices. Remember that an I/O system is not only specified by its size ( "I need 10 TB") – but also by its sustainable speed ("I want 20,000 IOPs"). Memory boundA very important question that you need to answer when using Integration Services is: "How much memory does my package use?" The key counters for Integration Services and SQL Server are:
|
3.
|
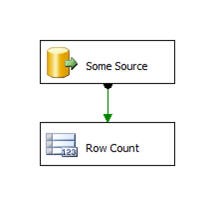
Baseline source system extract speed.Understand your source system and how fast you extract from it. After all, Integration Services cannot be tuned beyond the speed of your source – i.e., you cannot transform data faster than you can read it. Measure the speed of the source system by creating a very simple package reading data from your source with the a destination of "Row Count": Execute the package from the command line (DTEXEC) and measure the time it took for it to complete its task. Use the Integration Services log output to get an accurate calculation of the time. You want to calculate rows per second: Rows / sec = Row Count / TimeData Flow Based on this value, you now know the maximum number of rows per second you can read from the source – this is also the roof on how fast you can transform your data. To increase this Rows / sec calculation, you can do the following:
|
4. |
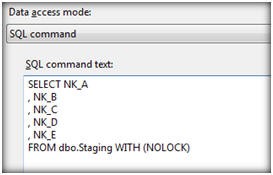
Optimize the SQL data source, lookup transformations, and destination.When you execute SQL statements within Integration Services (as noted in the above Data access mode dialog box), whether to read a source, to perform a look transformation, or to change tables, some standard optimizations significantly help performance:
|
5. |
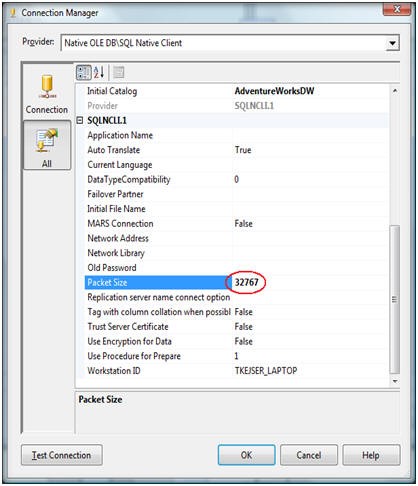
Tune your network.A key network property is the packet size of your connection. By default this value is set to 4,096 bytes. This means a new network package must be assemble for every 4 KB of data. As noted in SqlConnection.PacketSize Property in the .NET Framework Class Library, increasing the packet size will improve performance because fewer network read and write operations are required to transfer a large data set. If your system is transactional in nature, with many small data size read/writes, lowering the value will improve performance.Since Integration Services is all about moving large amounts of data, you want to minimize the network overhead. This means that the value 32K (32767) is the fastest option. While it is possible to configure the network packet size on a server level using sp_configure, you should not do this. The database administrator may have reasons to use a different server setting than 32K. Instead, override the server settings in the connection manager as illustrated below. Another network tuning technique is to use network affinity at the operating system level. At high throughputs, you can sometimes improve performance this way.For the network itself, you may want to work with your network specialists to enable jumbo frames to increase the default payload of 1,500 bytes to 9,000 bytes. By enabling jumbo frames, you will further decrease the amount of network operation required to move large data sets. |
6. |
Use data types – yes, back to data types! –wisely.Of all the points on this top 10 list, this is perhaps the most obvious. Yet, it is such an important point that it needs to be made separately. Follow these guidelines:
|
7. |
Change the design.There are some things that Integration Services does well – and other tasks where using another tool is more efficient. Your tool choice should be based on what is most efficient and on a true understanding of the problem. To help with that choice, consider the following points:
|
8. |
Partition the problem.One of the main tenets of scalable computing is to partition problems into smaller, more manageable chunks. This allows you to more easily handle the size of the problem and make use of running parallel processes in order to solve the problem faster.For ETL designs, you will want to partition your source data into smaller chunks of equal size. This latter point is important because if you have chunks of different sizes, you will end up waiting for one process to complete its task. For example, looking at the graph below, you will notice that for the four processes executed on partitions of equal size, the four processes will finish processing January 2008 at the same time and then together continue to process February 2008. But for the partitions of different sizes, the first three processes will finish processing but wait for the fourth process, which is taking a much longer time. The total run time will be dominated by the largest chunk. To create ranges of equal-sized partitions, use time period and/or dimensions (such as geography) as your mechanism to partition. If your primary key is an incremental value such as an IDENTITY or another increasing value, you can use a modulo function. If you do not have any good partition columns, create a hash of the value of the rows and partition based on the hash value. For more information on hashing and partitioning, refer to the Analysis Services Distinct Count Optimization white paper; while the paper is about distinct count within Analysis Services, the technique of hash partitioning is treated in depth too.Some other partitioning tips:
|
9. |
Minimize logged operations.When you insert data into your target SQL Server database, use minimally logged operations if possible. When data is inserted into the database in fully logged mode, the log will grow quickly because each row entering the table also goes into the log. Therefore, when designing Integration Services packages, consider the following:
|
10 |
Schedule and distribute it correctly.After your problem has been chunked into manageable sizes, you must consider where and when these chunks should be executed. The goal is to avoid one long running task dominating the total time of the ETL flow.A good way to handle execution is to create a priority queue for your package and then execute multiple instances of the same package (with different partition parameter values). The queue can simply be a SQL Server table. Each package should include a simple loop in the control flow:
Picking an item from the queue and marking it as "done" (step 1 and 3 above) can be implemented as stored procedure, for example. The queue acts as a central control and coordination mechanism, determining the order of execution and ensuring that no two packages work on the same chunk of data. Once you have the queue in place, you can simply start multiple copies of DTEXEC to increase parallelism.
|
Comments
Anonymous
December 31, 2013
Very detailed and useful. Thank you Aamir Shahzad http://sqlage.blogspot.com/Anonymous
January 27, 2014
Thank you for this really useful list - found a lot of practical, helpful tips here!Anonymous
April 08, 2014
Appreciate the level of detail & practical scenarios to adopt best practices appropriately. Thank you very much! Joseph PeterAnonymous
May 19, 2014
This a very helpful article. Thanks a lot DavAnonymous
February 18, 2015
Thank you for sharing. Very helpful.Anonymous
April 06, 2015
Thank you for sharing these Great tips.Anonymous
April 28, 2016
Thank you very much!Anonymous
October 27, 2016
Well written. Thanks.


