Silverlight toolkit with ADO.NET Data services , Drill-down Charts using Astoria
Download sample project here :
In part 2 of this series , we will look at using the Astoria client library to create a drill down chart using the chart types available in the Silverlight toolkit.
You can take a look at the complete samples for the Silverlight toolkit here.
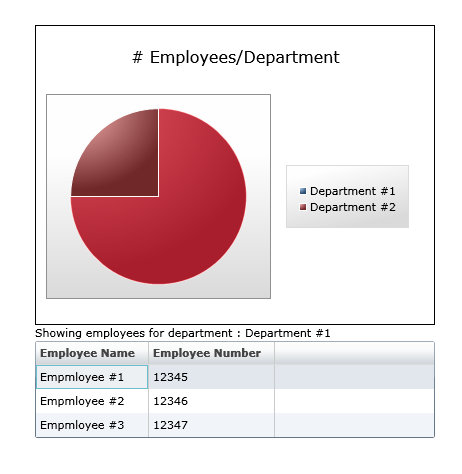
This sample builds a UI that looks like this :
The Pie chart represents the distribution of Employees across departments.
Clicking on a specific piece of the pie brings up the list of the employees in that department.
Binding the Pie chart
The Chart control has a Pie series that has the DependentValuePath set to the Count of employees in the department
and the IndependentValuePath set to the name of the department.
Setting the IndependentValuePath is straightforward ,set the IndependentValuePath to the “DepartMentName” property of the Department entity type. The DependentValuePath is a little tricky , as the Department entity doesnt contain aggregation information regarding the employees in the Department . But , it does have the employees as an ObservableCollection of Employee types . So , we can get the count by assigning the DependentValuePath to be the expression “Employees.Count” which gets the Count property of the IList. Unfortunately , this means that the Employees will also have to be downloaded when you bind the Departments. In another post , I will discuss how to lazy load the employees list and still get this aggregation.
XAML for Pie Series in Chart
   <chartingToolkit:Chart x:Name="chEmployeesByDepartment"
       Title="# Employees/Department" IsEnabled="true" Height="300">
      <chartingToolkit:Chart.Series>
         <chartingToolkit:PieSeries
                x:Name="lnSeries"
                IndependentValuePath ="DepartMentName"
                DependentValuePath ="Employees.Count"
                SelectionChanged="DepartmentSelected"
                IsSelectionEnabled ="True" >
         </chartingToolkit:PieSeries>
      </chartingToolkit:Chart.Series>
  </chartingToolkit:Chart>
The function to bind the Pie series with the Department information
  private void LoadDepartmentsAndEmployees() {
    DataServiceQuery<Department> deptQueryWithEmployees = context.Departments.Expand("Employees")
                                 as DataServiceQuery<Department>;
    deptQueryWithEmployees.QueryAndCall(
       (deparmentStatistics) =>  {
          Dispatcher.BeginInvoke(
           () =>  {
                PieSeries series = chEmployeesByDepartment.Series[0] as PieSeries;
                series.ItemsSource = deparmentStatistics;
               }
            );
         }); }
Populating employee information when a department is selected in the Pie Series
We need to setup the Pie Series in the chart control to allow selection of chart points and hook into the
SelectionChanged event of the Pie Series. We do this by:
- Setting IsSelectionEnabled to true on the Pie Series
- Hooking up to the SelectionChanged event of the Pie Series
         private void DepartmentSelected(object sender, SelectionChangedEventArgs e) {
            //Get the series that caused this  event to be raised
            PieSeries series = sender as PieSeries;
            //Get the current selected department in the Series
            Department selectedDepartment = series.SelectedItem as Department;
            if (selectedDepartment != null) {
                //Set the title of the data grid
                lblSelectedDepartment.Text = String.Format(strSelectedDepartmentMessage, selectedDepartment.DepartMentName);
                //Bind the employee grid with the employees for this department
                dgEmployees.ItemsSource = selectedDepartment.Employees;
            }
        }
Download sample project here :
Comments
Anonymous
June 11, 2009
PingBack from http://www.alvinashcraft.com/2009/06/11/dew-drop-june-11-2009/Anonymous
June 11, 2009
Daily tech links for .net and related technologies - June 11, 2009 Web Development Opinionated Input
