TCP Analyzer Expert: Make Your Network Run Faster
Performance problems suck...time! But years of "Where's Waldo" has trained our brains in preparation for this moment. The TCP Analyzer expert, available from our Experts Download Page[ https://go.microsoft.com/fwlink/?LinkID=133950\] takes advantage of that training by graphically representing TCP traffic. By looking at normal traffic or comparing the presented picture graph to some known TCP issues you can easily diagnose performance problems.
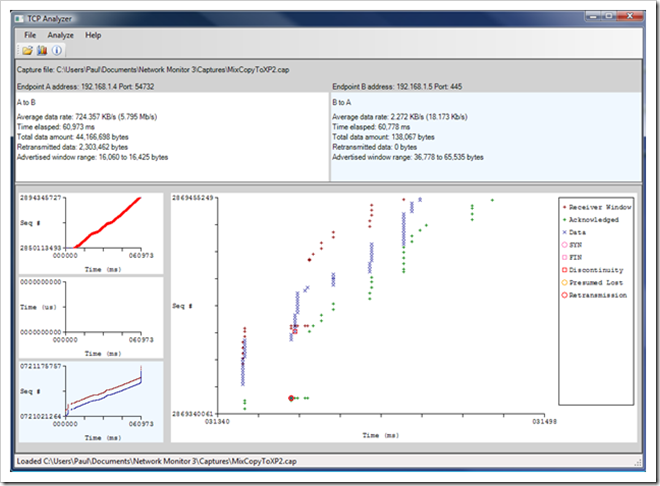
With the TCP Analyzer Expert you can load a trace, use the conversation tree to locate a TCP stream, and run the expert. If you don't have anything selected, the expert will use the first TCP conversation in the trace. Once it's run it presents you with a UI which will allow you to graph the TCP traffic, Analyzer Round Trip Time, and do some high level diagnosis based on some known issues.
How to Analyze Traffic
Say you suspect a problem or want to analyze some traffic. The first thing you need to do is collect a trace using Network Monitor. TCP Analyzer can try to "guess" the general problem and describe the issue. But for this to work properly you will need to take the trace from the machine initiating the connection. Also it helps to have the entire TCP connection as the window size is negotiated during the TCP 3-way handshake.
Once you start a trace, you then reproduce the performance test and stop the capture. Then save the capture, as Experts can only be run on saved traces. Go back to the start page where you'll see the file you just saved in the recent capture list and open it up.
Finding the TCP Conversation
The next trick is locating which TCP stream you want to run the expert on. In this case I copied a file using explorer and I knew then name of the file I copied. So I created the following filter.
ContainsBin(FrameData, UTF16BE, "myfile")
It could have potentially been ASCII as well, but with SMB I knew it would probably occur as Unicode. BTW, UTF16BE stands for Unicode 16 Big Endian. These days Unicode has many flavors, but UTF16BE is the most common one for Windows machines.
This filter located a bunch of SMB frames which meant I was on the right track. I right clicked a frame, selected Find Conversation, and choose TCP. This locates all other frames in the same conversation which the TCP Analyzer will use to determine which stream to use when it runs. Remember, to see the full stream in Network Monitor, remove the display filter you used to find the frame originally.
Now with the correct conversation selected, I run the TCP Analyzer Expert form the Experts menu. This runs the expert, but in order to get a graph to show up I have to press the graphing button from the toolbar.
Since there is traffic flowing in both directions, you need to determine which you want to concentrate on. You can use the port or IP address to figure this part out. Once you make this determination click the graph. This will display the graph in the main window allowing to you zoom in/out with the mouse wheel and you can drag the main graph around as well to pan.
You can also analyze the Round Trip Time, which is the graph in the middle. However there are some restrictions that have to be met before any information will be available. We won't cover RTT in this blog, but you can see the help for the expert for more information.
Decoding the Graph
The Axis
The Y axis shows the sequence numbers for the given direction. These are defined by TCP when a session initializes. Each sequence number represents the number of bytes transmitted. So sequence 1000-2000 represents 1000 bytes.
The X axis is time and is measure in (ms). This matches the offset as displayed in Network Monitor.
Legend Details
On the time-sequence graphs there are various symbols which can occur. Here's a list of what they mean. 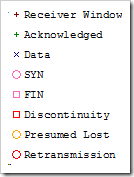
· Receiver Window - Receiver is telling the sender it is currently willing to receive up to this point in the data stream.
· Acknowledged - Receiver is telling the sender it has successfully received all the data up to this point in the data stream.
· Data - The point in the data stream the sender is currently sending.
· SYN - The SYNcronize packet sent at the start of the connection.
· FIN - The FINish packet sent at the end of the connection.
· Discontinuity - Any break in the data stream where the data in the indicated packet doesn't sequentially follow the data in the previous packet. Out-of-order, lost, or retransmitted packets can all cause discontinuities, as can gaps in the capture.
· Presumed Lost - A packet that was later retransmitted (if a sequential group of packets are all later retransmitted, only the first one will be indicated this way).
· Retransmission - A packet that is a retransmission of another packet in the capture.
Understanding Bandwidth-Delay Product
The speed at which you can send data in TCP is dependent on both the bandwidth of your network and the delay. The bandwidth is often referred to in terms like 10Mbps or 100Mbps, which is in bits per second. The delay is how long it takes for data to travel from one place to another and back. While this is related to the speed of light, other things like routers and the computers that are communicating can increase this delay as it takes time to process packets.
By multiplying bandwidth and delay together, we get the maximum amount of data that be "in flight" over one connection between two computers. As you'll see, whether this maximum is utilized depends on how well TCP is tuned. It's important to understand as the delay gets longer it becomes more important to fill the available window.
Pictures of Wrong Behavior
In TCP there are some typical problems that creep up over and over. Sometimes these are configuration issues with the client/server TCP stack or application. And in some cases, the problems can be easily fixed by adjusting the application or TCP window size. Of course, this may also be caused by your network which may require more drastic measures.
The best way to understand right from wrong is to base-line your network when it is working properly. This way you can look at the bandwidth numbers alone and understand if you have degraded. But in absence of this data, you can use the following pictures as a reference in order to identify some common problems.
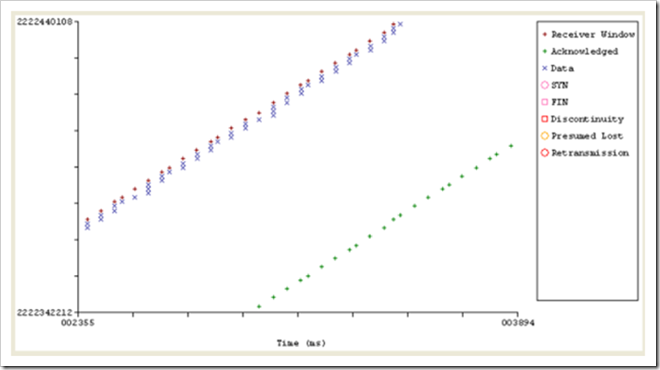
Bandwidth Limited:
In this case you see that the sent data fills up the window as the data packets (blue X) approach the receive window (red X). The packets are sent at a regular interval, so the only thing limiting your through put is the available bandwidth. This is normally what you want to see as your throughput will always be limited by something.
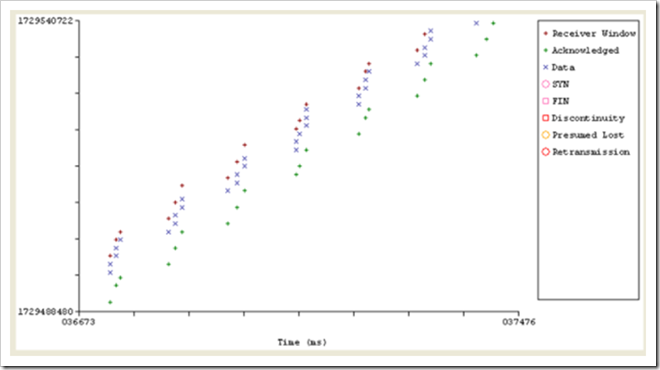
Receiver Limited:
The packets fill the receiver window, but they go out in bursts as fresh acknowledgement packets arrive and open up the window. This burstiness is an indicator that the window is smaller than the delay-bandwidth product, and thus the protocol can't keep the data stream flowing smoothly.
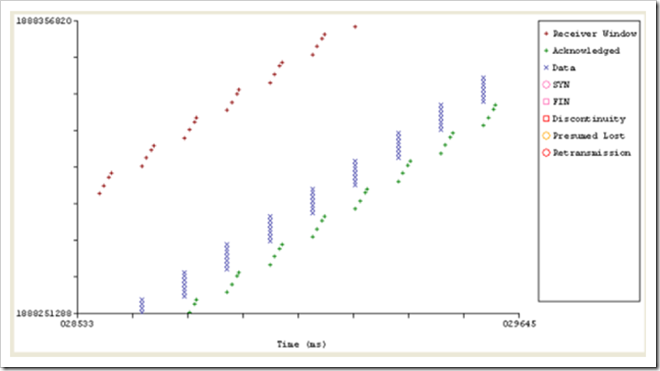
Sender Limited:
This indicates that one end's window size is less than the bandwidth-delay product. However, unlike the receiver-limited case above, the data packets fall well short of filling the receiver's advertised window. This is a good indicator that the sender's window was the limiting factor. In some cases this is because the application doesn't fill the window completely. As this often does not show up under low latency, a developer might not detect this type of problem in testing.
Congested Limited:
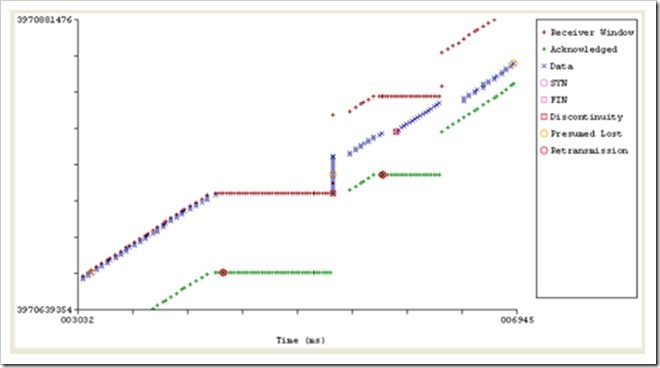
The earlier data points (lower left) look like a bandwidth-limited connection, until two lost packets cause TCP to severely limit the sender's congestion window after recovering from the losses. Note that the last data points (upper right) show the data packets aren't filling the receiver's advertised window as TCP is limiting the sender to a smaller congestion window.
It's important to note that the pictures were created in test environments. Real word applications tend to be more conversational and you'll often have to narrow down the part of the picture you need to focus on. For instance when you start a file copy with explorer, there's a lot of traffic that goes back and forth as you browse for the folder, select the file and then finally drag and drop it on the destination folder. You'll have to learn how to differentiate the actually transfer part from the rest of the traffic.
Power of the Picture
TCP Analyzer does an awesome job of taking a lot of information and summarizing in a picture that can be used to give a good overview of your network’s performance. It can take practice to learn how to read as you understand these scenarios that were presented as well as others. But as you learn you'll find that this is a powerful tool in your tool belt.
Comments
- Anonymous
January 01, 2003
thanks - Anonymous
April 25, 2014
Pretty good explanation!!!! - Anonymous
July 30, 2015
Wow, this is so helpful. Exactly what I was looking for. Thank you!
