Total, Application, Kernel, Overhead, Other samples - what are they all about?!
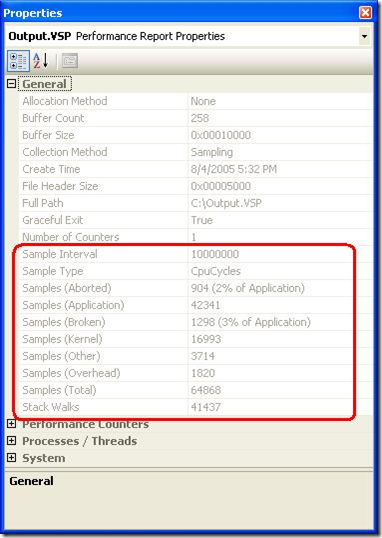
VS Profiler usage in Sampling mode results in generation of VSP file. This file is, naturally, full of samples that were taken during your profiling session. You can get a Properties Window of this file by pressing F4 button:
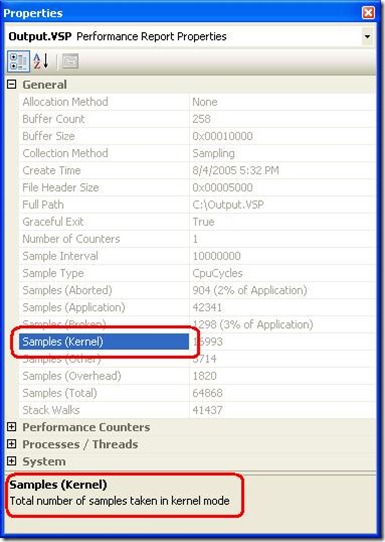
Today I would like to talk about all different Samples that are reported in General section of this window. Those samples were collected, some of them are used to generate profiler views, and sometimes you may want to understand better the whole picture - how many samples were taken during the session, are all of them in your application, why do you see less samples than you think you should see, etc. This may shed some light on confusing situations, if you try to compare results of VS Profiler with results provided by other tools (for example, when you use Page Fault Sampling, and you compare number of collected samples with a number of page faults reported by performance monitor).
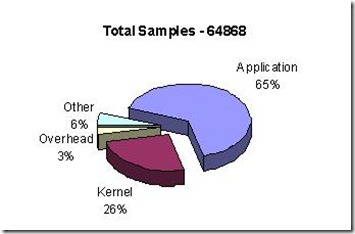
So, all samples collected during the performance session are reported as Total. VS Profiler divides them into the following groups:
- Application - samples taken in context of profiled application
- Kernel - samples taken in kernel mode (system wide)
- Other - samples taken in other applications, that are not profiled
- Overhead - samples taken in profiler runtime
From all the pieces, the Application slice is the one that is used for further analysis. Samples from other group are currently not counted in final results.
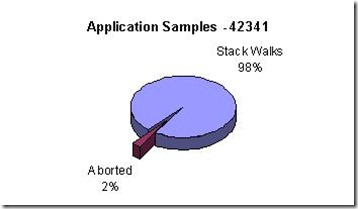
Some samples within the Application may be Aborted, if they happen to be taken at "bad" time (for example, during garbage collection). For the rest of samples, VS Profiler detects a call stack chain that resulted in execution of the current function.
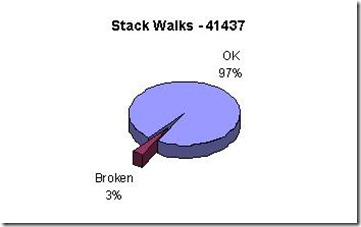
Sometimes, profiler cannot detect a full call stack, and detects just most part of it. Those stacks are reported as Broken samples. Both, Broken and full stacks are used for generation of profiling results that are presented in Performance Tools views of Visual Studio Team System.
Trying to summarize all the above, we may present a samples distribution hierarchy in the following way, where only Full and Broken stacks are currenlty taken into account for final results.
- Total
- Application
- Stack Walks
- Full stacks
- Broken stacks
- Aborted
- Stack Walks
- Kernel
- Other
- Overhead
- Application
And you may also get explanation of each line in Properties Window of VSP file by selecting it:
If you want to collect more samples and have more stacks reported within you application, you may either run the application longer, or change sampling frequency (either through /PF, /SYS, /TIMER options of VSPerfCmd.exe command line tool, or in Sampling property of Performance Session in VSTS).
Comments
- Anonymous
March 06, 2006
The comment has been removed - Anonymous
April 25, 2006
I just found out something neat.  VSTS tells you how many samples were taken in kernel mode. Unfortunately,...
