Playing with Kubernetes livenessProbe and readinessProbe probes
Disclaimer: Cloud is very fast moving target. It means that by the time you’re reading this post everything described here could have been changed completely  . Hopefully some things still apply to you! Enjoy the ride!
Liveness and readiness probes are excellent way to make sure that your application stays healthy in your Kubernetes cluster.
If you're not familiar with it then please checkout some documentation before continuing:
Now you should have pretty good idea what health check probes are and how you configure them.
However you might want to get some hands-on experience in order to understand them better.
And that's the reason why I've created this post... to help you understand how these work in practice
in many different scenarios.
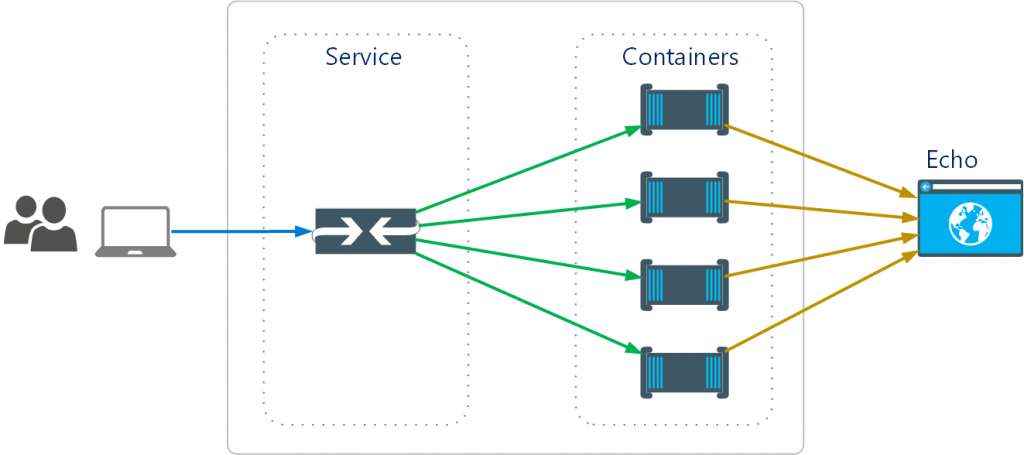
Okay let's set up the scene. First let's take a look at the high level setup of Kubernetes Probe demo application:
In above diagram you'll see Service taking in requests and then forwarding them to the
actual application instances running in containers. And in this case since we are in Kubernetes
world we'll mean Kubernetes Service.
Behind the service there are our worker bees a.k.a. containers that do the actual work in our application.
We'll then have a bit outsider friend which I've named "echo". This is used for reporting the
probe statuses, different events from containers etc. It's effectively just view to see what's going
on in our application.
Application that we're going to run in this example is Kubernetes Probe Demo.
This we can use to learn more about the probes and other failure handling scenarios. It's ASP.NET Core 2.1
application which has the most plain front end page ever:
But more importantly it has API endpoint that enables us to poke around with it:
/api/HealthCheck
To get the current probe statuses use:
GET /api/HealthCheck
To get the current liveness probe status use (this is used by Kubernetes also):
GET /api/HealthCheck/Liveness
To get the current readiness probe status use (this is used by Kubernetes also):
GET /api/HealthCheck/Readiness
To change the status of the probes or close the application use this:
POST /api/HealthCheck
This expects json payload with following format:
{ "readiness": boolean, "liveness": boolean, "shutdown": boolean }
First two ("readiness" and "liveness") control the probe states and third one ("shutdown") can be used
to close down the application (which causes that container to exit).
If you do not provide value for the properties in your payload then it uses default value of boolean (=false).
Application reports probe statuses and different events using webhooks. That's the reason
we had echo in our above diagram.
You can use any online services that provide functinality to view webhook requests but
in this case we'll use this another ASP.NET Core 2.1 application for that purpose.
You don't need to clone the source of the echo if you just want to spin it up in your Kubernetes.
You can use this echo container image for that purpose.
Here is example Echo.yaml that can be used for deploying this to your cluster:
Or just use this command to do the deployment:
Now you should have echo running in https://localhost:31111/.
You can try to post data to see if it works correctly using the instructions given in the web page:
You can clean up your previous post just by refreshing the view in your browser.
For now leave one browser window open for this address since we're coming back to this view soon.
Okay now we have our helper service up and running and we're ready to deploy our primary
application. If you want to checkout the code then head to the GitHub.
We'll use this yaml file:
If you just want to deploy the application using example yaml and ready made container then
you can use these steps:
On purpose we first get the yaml file to local filesystem so that we can then later edit that
according to our test scenarios.
After running above commands you should have application running and it should be
reachable from this address: https://localhost:32001 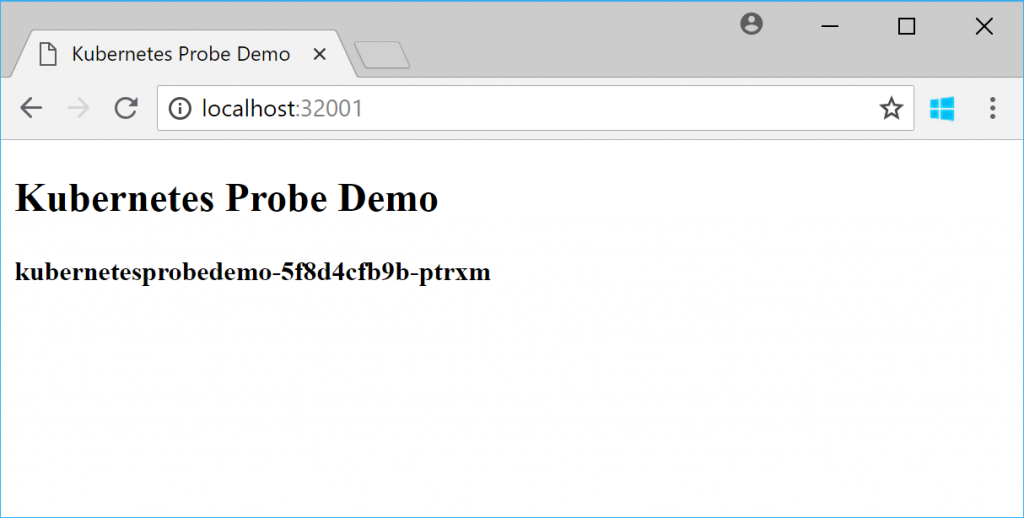
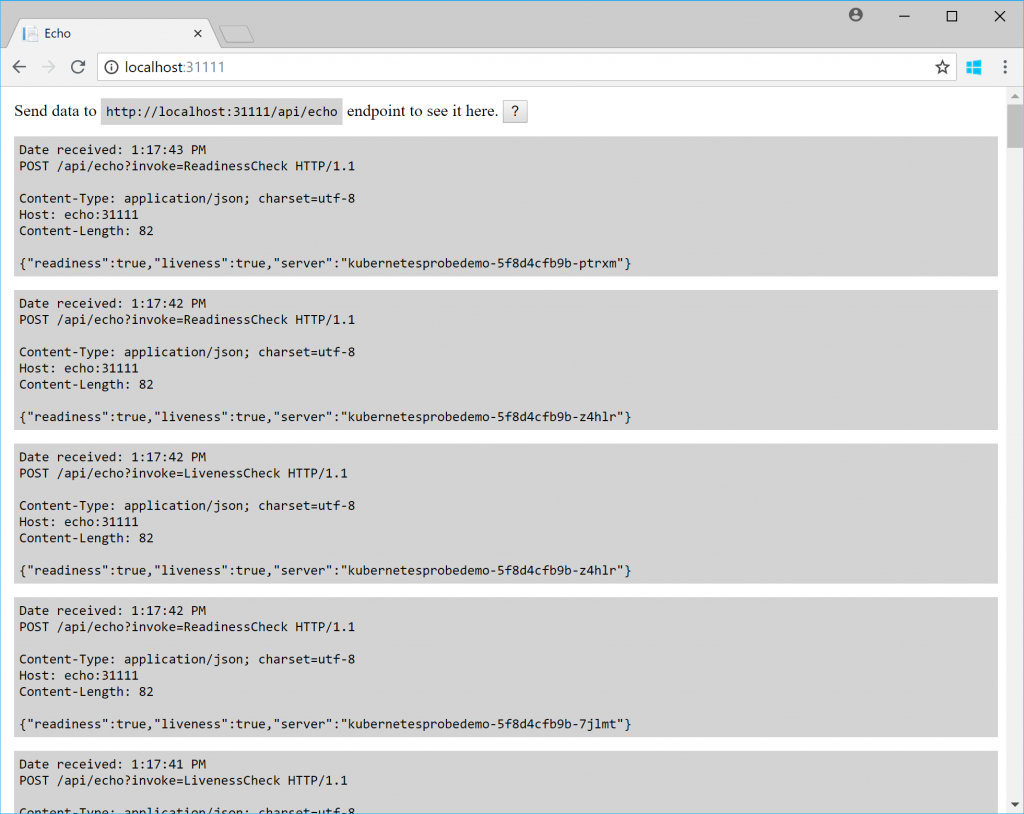
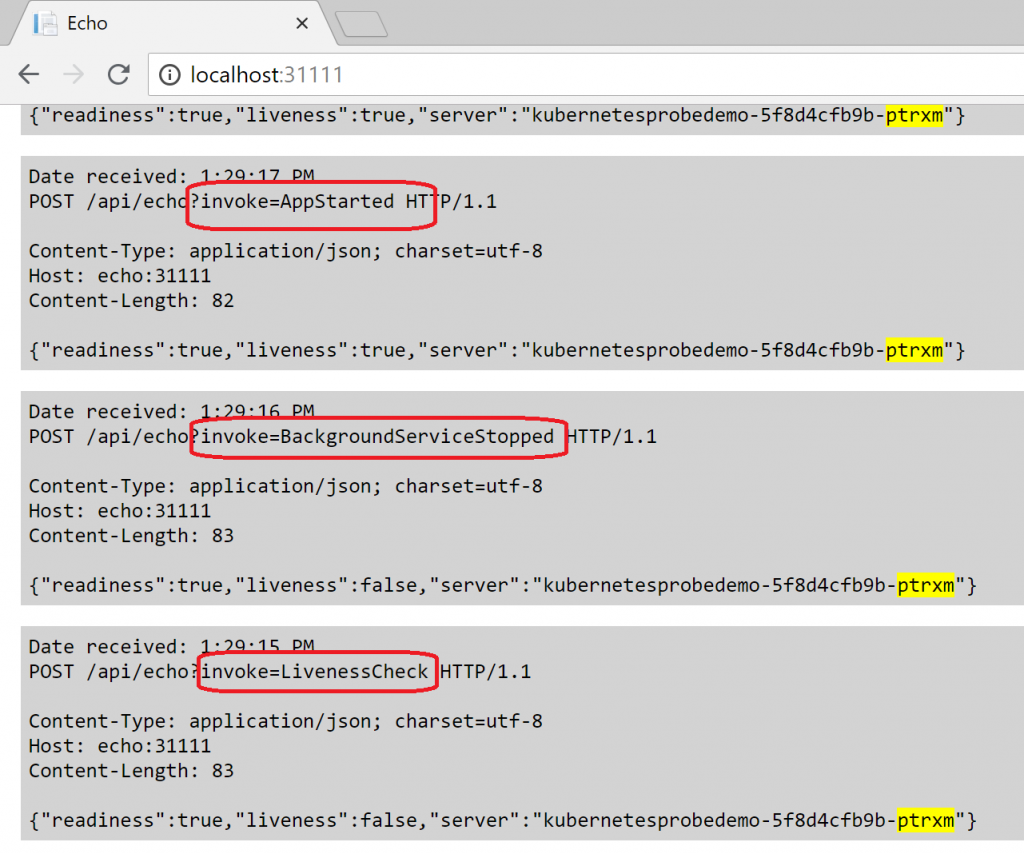
Now if you still have Echo open in your browser then it should start showing different events:
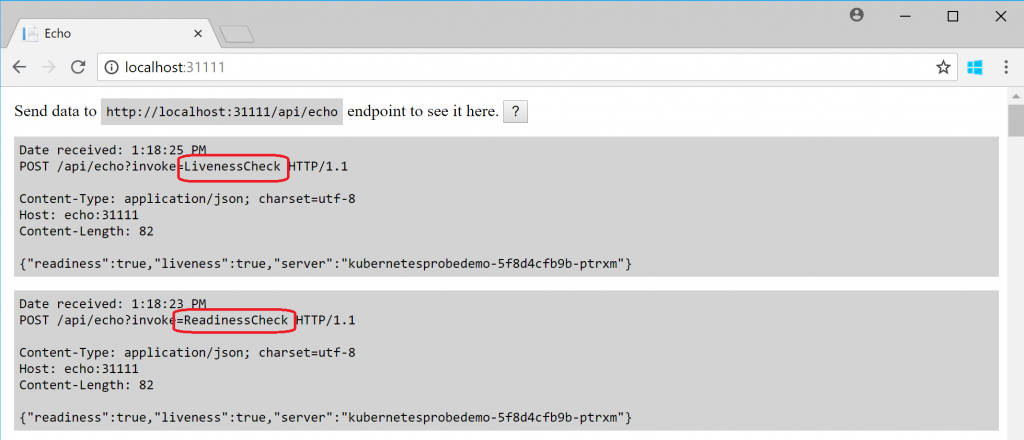
This could be the first time that you'll notice one interesting thing. Since we have configured
both liveness and readiness probes we can see both events in the view:
This might be a bit surprising at first since might think that
readiness probe is just used for the "start up readiness check" but it's not. Readiness checks are executed in regular intervals just as you have configured them.
If you check with kubectl your should see 3 instances of our application running:
And if you managed to get this far then you're actually ready to (finally!) try out some scenarios.
Scenario 1: Post "shutdown" command using the Rest API curl -d '{"shutdown":true}' -H "Content-Type: application/json" -X POST https://localhost:32001/api/HealthCheck 
If you then continue to update your Kubernetes Demo App view in your browser you should notice that the
application still continues to work even if one container just was forced to exit.
Kubernetes has noticed this and is bringing back new instance according to the defined replica count in your yaml file:
Conclusion: Kubernetes has bring that instance after it has exited. Read more about the restartPolicy in Pod Lifecycle documentation.
Scenario 2: Fail the liveness probe curl -d '{"readiness":true,"liveness":false}' -H "Content-Type: application/json" -X POST https://localhost:32001/api/HealthCheck
Now you should notice this also in kubectl:
And also in echo since there are events related to the closing the background processing service and event related to app started:
Conclusion: If Kubernetes notices that liveness probe reports failure it will recycle the container to get it back on track.
Scenario 3: Fail the readiness probe
This one is a bit more complicated. First we'll take note about the current container name which is visible in the browser. Then
we'll post readiness probe failure for that specific container and observe what happens:
Here are the actual commands that I've used:
After I've set that to fail the readiness check you can still see that same name in your browser before
Kubernetes doesn't anymore route traffic to it. However Kubernetes doesn't recycle that container but
it waits and waits it to recover. You can refresh your browser (CTRL+F5) to see that container doesn't anymore
receive traffic:
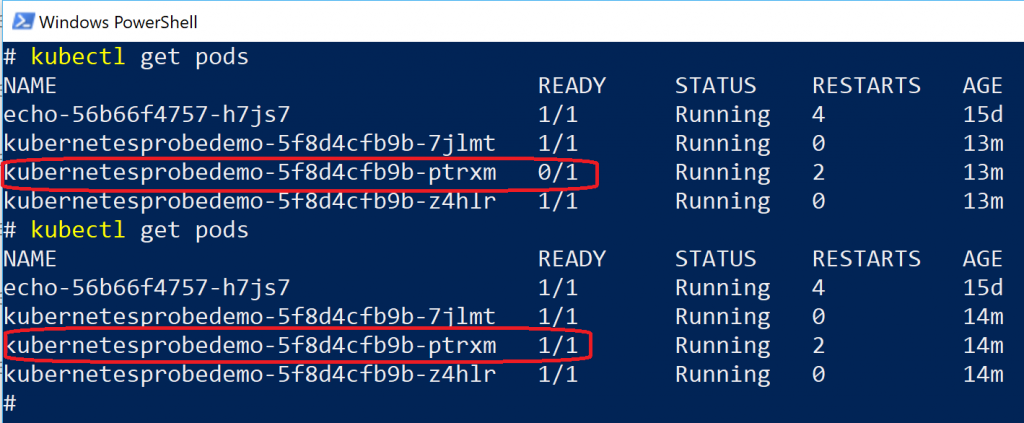
And if you use kubectl to check the status you'll see that pod is not reported to be ready:
Conclusion: Kubernetes waits patiently container to recover in case readiness check fails.
Those 3 scenarios were the ones I wanted to cover in this post. However you can continue with all sorts
of different scenarios and topics such as:
- Change configuration so that container will crash at start up.
- Example: Change value of readinessCheck from "true" to "true 123" (cannot be converted to boolean and causes failure in startup).
- Deploy this update yaml and see how Kubernetes manages the situation (use e.g. "kubectl get pods" or "kubectl rollout status deployment kubernetesprobedemo").
- Isn't this good place to catch configuration issues? Throw on startup to the rescue!
- Telemetry and probe events
- If you collect telemetry from you application (e.g. Application Insights) then how do you handle telemetry
events caused just by probes (hint)? You can calculate how much telemetry just your different services
and their many instances generate from these probes.
- If you collect telemetry from you application (e.g. Application Insights) then how do you handle telemetry
- App health monitoring libraries
- This demo application didn't use any ready made libraries but you should definitely
check them out. Here's one good article in ASP.NET Core Health monitoring.
- This demo application didn't use any ready made libraries but you should definitely
You can find the source code used in this example application from GitHub:
JanneMattila / Echo JanneMattila / KubernetesProbeDemo
and images from Docker Hub:
JanneMattila / echo JanneMattila / kubernetesprobedemo
By the way... When I was drawing out the above diagram I've found out about Microsoft Integration Stencils Pack. It contains really cool symbols and icons so I really recommend you to check it out.
