SQL Server 2014 Dynamic-link library load
Have you ever wondered how SQL Server 2014 accomplishes the “Native compilation” feature? In this post I’ll show you how to inspect what SQL Server is doing behind the scenes while “compiling” your native code. This will be a deep post that will require a non production instance since we will restart it many times.
In order to inspect sqlservr.exe we will use a powerful tool called Dependency Walker. You can find it in many Microsoft distribution kits; the author, however, keeps an update page with the latest binaries: you can get them here: http://dependencywalker.com/.
Dependency walker allows you – among other things - to inspect dynamic DLL handling by user code. That is exactly what SQL Server is doing when loading your native compiled code into its own address space.
SQL Server will perform these tasks:
For each natively compiled entity. Note that is just an oversimplification meant to show what happens in that specific moment. There is a lot more involved before (Mixed Abstract Trees, Pure Imperative Trees, etc…) and afterwards of course.
First, we need to start dependency walker and ask it to open the main SQL Server executable. If you have trouble finding the right exe you can use the SQL Configuration Manager:
Once open Dependency walker will show you the module linked by the executable. You will find the familiar DLLs here:
This is, however, the static representation of sqlservr.exe. Dependency walker is able to inspect a running instance of that executable much like a debugger does. This is very helpful since we want to show what happens during a native compilation.
Select Start profile from Profile menu:
As you can see we are starting sqlservr.exe from scratch. You will need to shut down the running instance first (there cannot be two instances owning the same files) and copy the relevant parameters from the configuration manager. If you want more details on how to start SQL Server from command line please refer here: http://technet.microsoft.com/en-US/library/ms180965(v=SQL.105).aspx.
You will see the console popping out: just wait for SQL Server to finish its initialization (note: if you already have many natively compiled entities the startup will take a while; this is normal and the reason of if should become clear in a moment).
Before proceding further let’s look at the Window menu of Dependency Walker:
Notice that SQL Server has spawned another process during its startup: CONHOST.exe. DW will show the latest process spawned as default so we need to select sqlservr.exe back before proceeding further.
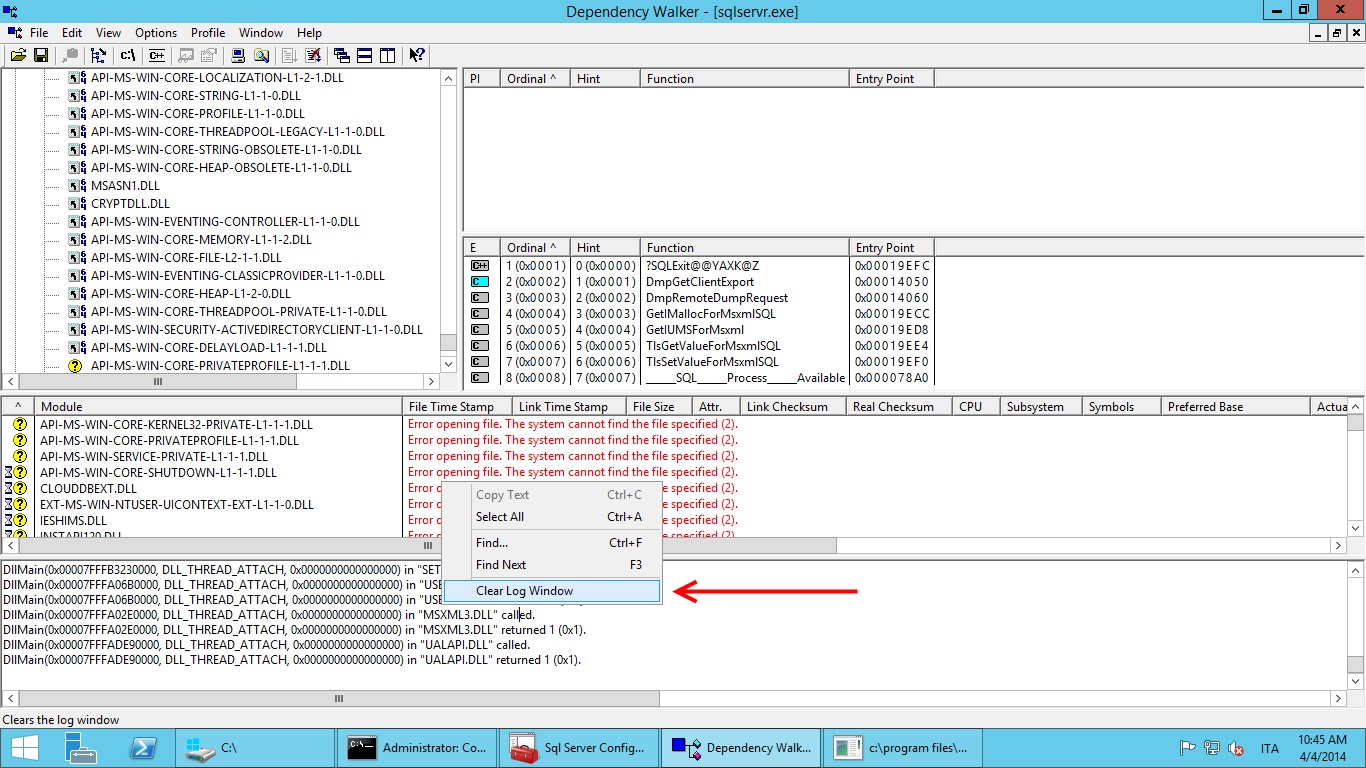
If you want you can clear the Dependency Walker’s log window now:
 Now that our instance is running and Dependency Walker is actively monitoring it we can create a demo database on it (we can use SSMS, sqlcmd, whatever you like):
 CREATE DATABASE [NativeDemo]
ON  PRIMARY
( NAME = N'NativeDemo_data', FILENAME = N'C:\Demo\NativeDemo_data.mdf'),
FILEGROUP [InMemoryOLTP_InMemory] CONTAINS MEMORY_OPTIMIZED_DATA
( NAME = N'NativeDemo_memopt', FILENAME = N'C:\Demo\NativeDemo_memopt')
LOG ON ( NAME = N'NativeDemo_log', FILENAME = N'C:\Demo\NativeDemo_log.ldf')
GO
Now we try and create a natively compiled table. Note that as soon as we start the batch Dependency Walker will start to output info (that’s what we wanted in the first place) and slow down the batch considerably:
 USE [NativeDemo];
GO
CREATE TABLE [Customer](
    [PKIDBucketCount64] INT NOT NULL PRIMARY KEY NONCLUSTERED HASH WITH (BUCKET_COUNT = 64),
    [AnINTField] INT NOT NULL,
  [AVarchar200Field] VARCHAR(200) NOT NULL,
    [ANVarchar500Field] NVARCHAR(500) NOT NULL
 )
WITH (MEMORY_OPTIMIZED = ON,  DURABILITY = SCHEMA_AND_DATA  );
GO
If all went well we should have our own table. Now go back to Dependency Walker and look at the Window menu:
As we can see there are two new processes captured by Dependency Walker: CL.exe and LINK.exe. These are the compiler and the linker processes spawned by SQL Server for the native compilation of our table.
Let’s start selecting CL.exe.
If we scroll all the way up in the log we will find something like this:
Worth noting here are the command line parameters. In my case they were:
Program Arguments: /O2 /d2Zi+ /GL /Z7 /Gy- /I "C:\Program Files\Microsoft SQL Server\MSSQL12.P00\MSSQL\Binn\Xtp\gen\include" /W3 /wd4101 /wd4723 /wd4724 /wd4049 /WX /GS /fp:strict /LD "xtp_t_6_277576027.c" hkgenlib.lib hkruntime.lib hkengine.lib hkgenexp.exp hkcrt.lib hkk32.lib hkversion.obj /link /LIBPATH:"C:\Program Files\Microsoft SQL Server\MSSQL12.P00\MSSQL\Binn\Xtp\gen\lib" /LIBPATH:"C:\Program Files\Microsoft SQL Server\MSSQL12.P00\MSSQL\Binn\Xtp\VC\lib" /noentry /nodefaultlib /incremental:no /ltcg /wx /FUNCTIONPADMIN
If you have experience in C Windows coding you will recognize many of them. Just to point a few, notice the /7Z flag that helps debugging; for the performance point of view notice the /O2 flag that asks the compiler to perform code optimization favoring speed over size (see http://msdn.microsoft.com/en-us/library/8f8h5cxt.aspx) while the /fp:strict flag forces the floating point operations to favor precision over speed (see http://msdn.microsoft.com/en-us/library/e7s85ffb.aspx).
Now if we switch to SQL Server process, we should see something like this:
Notice two things here:
SQL Server calls LoadLibrary (see http://msdn.microsoft.com/en-us/library/windows/desktop/ms684175(v=vs.85).aspx) to import in its own process the DLL just compiled.
SQL Server calls GetProcAddress to find the address of the exported functions (see http://msdn.microsoft.com/en-us/library/windows/desktop/ms683212(v=vs.85).aspx).
Now SQL Server 2014 can call the compiled functions just pointing at the (local) address given by GetProcAddress.
Happy Coding,


