[Windbg Script] Digging the Call Stack
Windbg has a lot of commands and command variations, so sometimes you may forget some of them, like when you need to dig a call stack to extract more information. Or maybe you remember the commands to get the call stack details, but you need to make sure you get the entire stack. Or yet you may want a way to quickly dig the stack and get information first from the frames and then from the local variables without spending too much time typing commands or using the arrow keys.
If you see yourself in one of these scenarios, this script is for you!
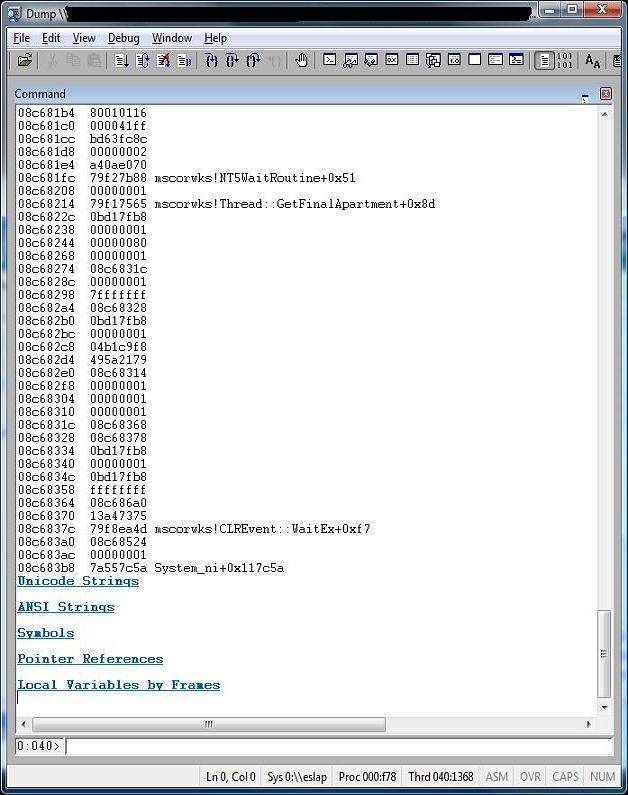
This script enables you to quickly get the following information from the call stack:
- ANSI strings.
- Unicode strings.
- Symbols.
- Pointer references.
- Local variables by frames. (requires private symbols)
The interface is very simple and probably not so beautiful. Be glad I’m not part of the Windows GUI team. J
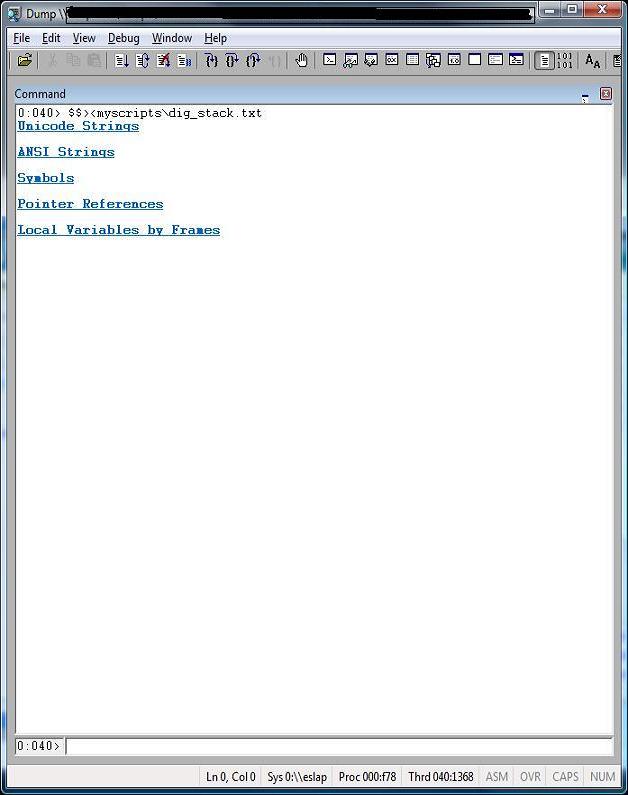
These are two screenshots to give you an idea:

Source code - DIG_STACK.TXT:
$$
$$ =============================================================================
$$ Dig information from the current call stack:
$$ - Unicode Strings
$$ - ANSI Strings
$$ - Symbols
$$ - Pointer references
$$ - Local variables by frames
$$
$$ Compatibility: Win32, should work on Win64.
$$
$$ Usage: $$>< to run the script.
$$
$$ If necessary change the filename below to include your path and filename.
$$ By default it uses the WinDbg path and the default file name is DIG_STACK.TXT
$$
$$ Roberto Alexis Farah
$$ Blog: https://blogs.msdn.com/debuggingtoolbox/
$$
$$ All my scripts are provided "AS IS" with no warranties, and confer no rights.
$$ =============================================================================
$$
.block
{
as ${/v:ScriptName} MYSCRIPTS\\DIG_STACK.txt
}
.block
{
.printf /D "<link cmd=\"dpu @$csp poi(@$teb+0x4);ad ${/v:ScriptName}; $$><${ScriptName}\"><b>Unicode Strings</b></link>\n\n"
.printf /D "<link cmd=\"dpa @$csp poi(@$teb+0x4);ad ${/v:ScriptName}; $$><${ScriptName}\"><b>ANSI Strings</b></link>\n\n"
.printf /D "<link cmd=\"dps @$csp poi(@$teb+0x4);ad ${/v:ScriptName}; $$><${ScriptName}\"><b>Symbols</b></link>\n\n"
.printf /D "<link cmd=\"dpp @$csp poi(@$teb+0x4);ad ${/v:ScriptName}; $$><${ScriptName}\"><b>Pointer References</b></link>\n\n"
.printf /D "<link cmd=\"kpM 2000;ad ${/v:ScriptName}; $$><${ScriptName}\"><b>Local Variables by Frames</b></link>\n"
}
$$ ===========================================================================
Comments
Anonymous
March 18, 2007
Cool post. Keep up the great job.Anonymous
March 19, 2007
This is a really useful script. Thank you so much for publishing it! Great work!!!Anonymous
March 21, 2007
Farah... great post, great blog, great work!!! Congratulations, Douglas Mello.Anonymous
March 29, 2007
Hi, I have used Windbg but am new to the script. So, I copied and pasted the script source code and got the following syntax error ^ Syntax error in '; as MYSCRIPTS\DIG_STACK.txt; MYSCRIPTS\DIG Any idea where I copied wrong ? BTW, my windbg version is 6.6. ThanksAnonymous
March 29, 2007
The comment has been removedAnonymous
March 30, 2007
Hi, Thanks for the additional info. I believe I have copied the script file into the correct folder as I purposely used an incorrect filename and Windbg complained. I ran the script once and nothing happened so I ran again and as you stated, that is why I got this error. I thought I would the screen #1 you psoted and because nothing happend, so I ran again. What should happen if I ran the script ? :-( BTW, I ran the script once and as you recommended ran al command and this is what happened: 0:001> $$><myscriptsdig_stack.txt 001> al Alias Value ------- ------- ScriptName MYSCRIPTS\DIG_STACK.txt; ThanksAnonymous
March 30, 2007
Hi, The Read Me talks about this alias problem. It happens when calling the script twice or calling another script that uses same alias names. I got a hard time with this issue when doing my first script. The al commands shows you the expected output now and this is one of the approaches I use to debug them. In your case the alias and value are correct. I suppose now it's running fine, right? Can you see the hyperlinks? When you click one of them it shows you the information then presents the links again.Anonymous
March 30, 2007
The comment has been removedAnonymous
March 30, 2007
Just want to clarify that I don't get any error message and yet don't see any link at all like screen #1 you posted. That's why may be somehow my Windbg's environment is wrong ????Anonymous
March 30, 2007
Hum... yes, it may be something with your Windbg. Try it using this version: http://www.microsoft.com/whdc/devtools/debugging/installx86.mspx However, remove your current Windbg installation then install the new one. I'm curious. :)Anonymous
March 30, 2007
My Windbg is 6.6.3.5 and the latest version is 6.6.7.5. Is your Windbg 6.6.7.5 ?Anonymous
March 30, 2007
The version I use at home is 6.6.7.5. Here at MS we have an internal version. Anyway, this is the problem, your Windbg version that is too old. Take a peek at this article: http://www.microsoft.com/whdc/devtools/debugging/whatsnew.mspx DML was introduced in version 6.6.7.5Anonymous
March 30, 2007
Great, mystery solved. Thanks. I will update later.Anonymous
April 02, 2007
I updated to the latest Windbg and these are my finding:
- For some reason, I needed to specify full path as follow: 0:001> $$><C:Program FilesDebugging Tools for Windowsdig_stack.txt
- I modifed the script to reflect this as follow: .block { as ScriptName C:\Program Files"Debugging Tools for Windows"\MYSCRIPTS\DIG_STACK.txt } Note that I have to use quote in "Debugging Tools for Windows"
- When I clicked Symbols, I got the following 0:001> .for(r @$t3 = @$csp; @$t3 <= @$t0; r @$t3 = @$t3 + 0xC;){.if(0 != poi(@$t3)){dps @$t3 L1}};ad /q *; $$><${ScriptName} 00a1ffcc 7c9507a8 ntdll!DbgUiRemoteBreakin+0x2d 00a1ffd8 00000001 00a1ffe4 ffffffff Memory access error at ')){dps @$t3 L1}' Am I missing something ? BTW, I just attached notepad and ran the script Thanks
Anonymous
April 02, 2007
Hey nativecpp, good to know it's working! :) You did right changing the path. This error happens because you used the script on a very small thread call stack. The script uses 0x300 as the call stack range. If you run it on a larger call stack it should run fine. Anyway, to avoid this situation I'm changing the script now, so you can try the updated version and see how it's working. Thanks for your feedback!Anonymous
April 18, 2007
The comment has been removedAnonymous
April 26, 2007
New update: This version is simpler, faster and always dumps the entire stack of the thread!Anonymous
September 03, 2008
http://blogs.msdn.com/debuggingtoolbox/archive/2007/03/18/windbg-script-digging-the-call-stack.aspx 글
